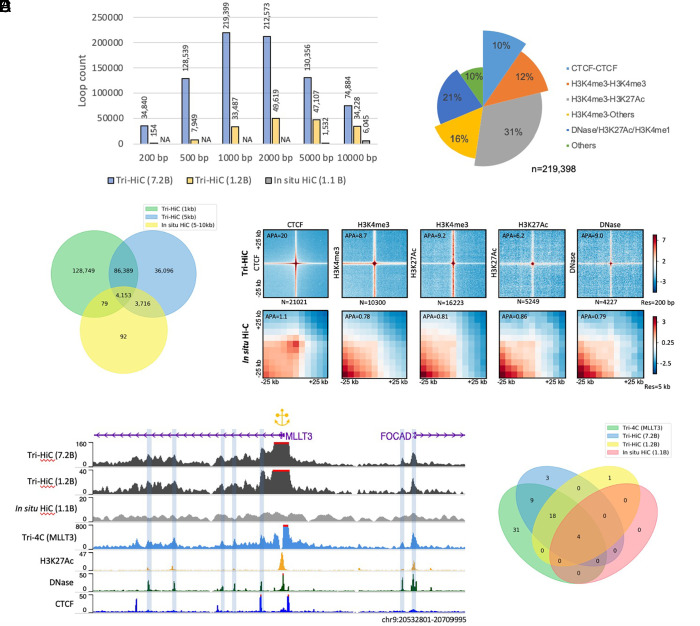
Fig. 3.
Identification of cis-regulatory loops by Tri-HiC. (A) Number of loops called by HICCUPS for Tri-HiC all (7.2 billion contacts), replicated #2 (1.2 billion contacts), and in situ Hi-C (1.1 billion contacts) at different resolutions for IMR90 cells. (B) Venn diagram indicating the overlap statistics of loops identified by Tri-HiC at 1 kb and 5 kb resolutions and in situ Hi-C. (C) Annotation of loops identified at 1 kb resolution. Loop annotations with multiple categories are classified to the category with the largest bar size. (D) Z-score transformed aggregated peak analysis (APA) of loops identified by Tri-HiC at 1 kb resolution sorted by annotations. The aggregated heatmaps are visualized in 200 bp resolution for Tri-HiC and 5 kb for in situ Hi-C. Loops annotated into multiple categories are included only once into the leftmost figure. (E) Comparison virtual 4Cs derived from Tri-HiC and in situ Hi-C with Tri-4C for MLLT3. (F) Overlaps of MLLT3 intra-TAD DNase loops identified by different methods.

