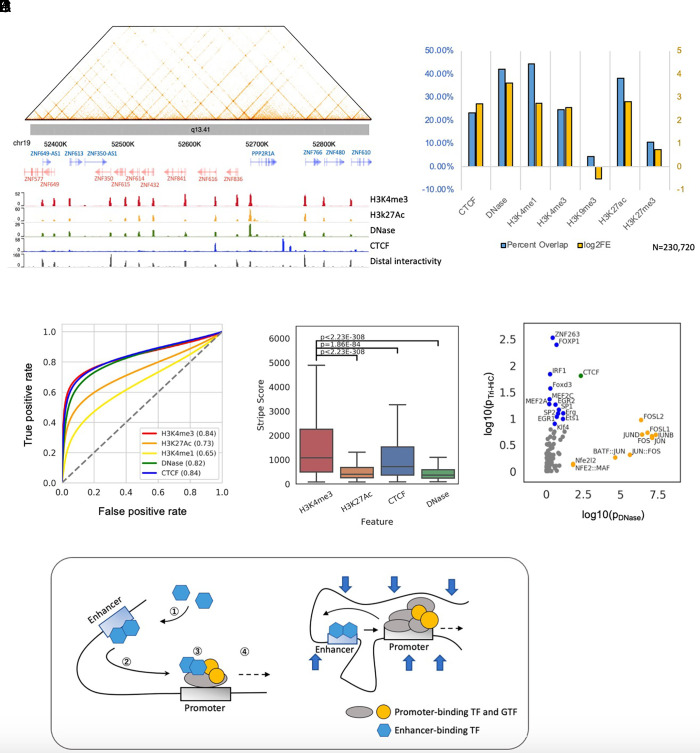
Fig. 4.
Tri-HiC identifies regulatory elements as distal interaction hotspots. (A) An example of gene promoters forming bidirectional nonspecific interaction stripes in chr19. Aligned with the landscapes of epigenetic marks, the distal interactivity track at the bottom indicates −log10 P value of distal interaction read count enrichment (Materials and Methods). (B) Percentage overlap and log2 fold enrichment (log2FE) of distal interaction hotspots identified by Tri-HiC with other 1D epigenetic marks. The interaction hotspots annotated into multiple categories are only included in the leftmost category. (C) ROC analysis using distal interactivity scores [−log(p)] for each 100 bp bin steps as predictors of CRE peaks. (D) Comparisons of distal interactivity scores for hotspots annotated with different epigenetic marks. Significance of differential interaction scores was calculated by using a two-sided t test. (E) Comparisons of motif enrichment scores (log10 P value) between IMR90 DNase peaks and distal interaction hotspots identified by Tri-HiC. (F) Hypothetical models interpreting the asymmetric insulation of promoter-enhancer loops. i) In the “transfer”/asymmetric loop extrusion model, ① enhancers recruit transcription factors and cofactors which ② mediates nonspecific interaction stripes before encountering the promoter. ③ Upon the contact, these factors are partially transferred from the enhancer to the promoter, ④ thereby weakening the enhancer interaction stripe downstream. ii) In the E:P retention model, enhancers are retained after meeting the preferred promoter. The large scaffold complex at the promoter thus blocks the enhancer from interactions further downstream, while the TF complex on the enhancer is not sufficiently large to prevent the promoter from interacting with the upstream target.

