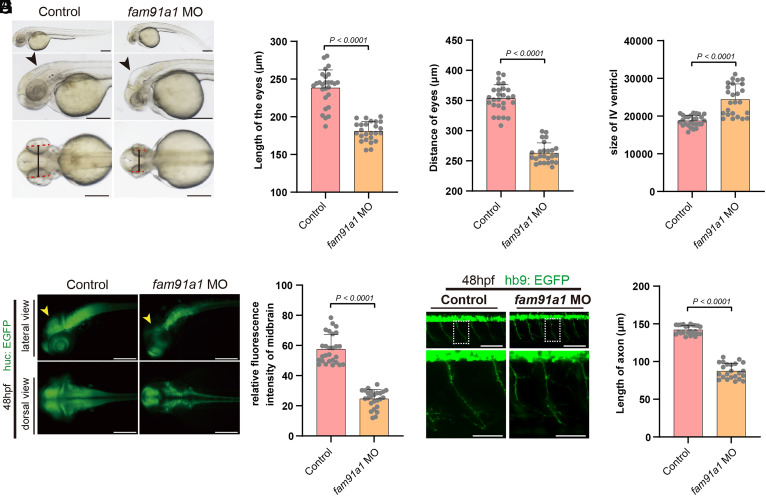
Fig. 1.
FAM91A1 is required for zebrafish neuronal development and brain growth. (A) Bright-field images of zebrafish embryos of control and fam91a1 MO zebrafish based on head and body morphology at 48 hpf (hours post fertilization). The dotted red line indicates eye length, the black solid line indicates eye distance, and the black arrows indicate the fourth ventricle. Control: control MO injection; fam91a1 MO: fam91a1 MO injection. All injections are performed at one cell stage of the development (Scale bar, 100 μm). (B) The length of eyes of embryos in control and fam91a1 MO zebrafish at 48 hpf. Experiments were repeated three times. Each dot represents one zebrafish and at least 20 zebrafish were used per group. Statistical comparisons were performed using an unpaired t test and data are presented as mean ± SD. (C) The distance of eyes of embryos in control and fam91a1 MO zebrafish at 48 hpf. Experiments were repeated three times. Each dot represents one fish, and at least 20 fish were used per group. Statistical comparisons were performed using an unpaired t test and data are presented as mean ± SD. (D) The size of the fourth ventricle of control and fam91a1 MO zebrafish at 48 hpf. Each dot represents one fish, and at least 20 zebrafish were used per group. The data are presented as mean ± SD. P values were calculated using unpaired t test. Experiments were repeated three times. (E) HuC (green) expression in Tg [HuC: GFP] transgenic zebrafish. Arrows indicate midbrain. Top, lateral views; bottom, dorsal views (Scale bar, 100 μm). (F) The midbrain area fluorescence intensity of embryos in control and fam91a1. The fluorescence intensity in the midbrain area of the fam91a1 MO group is approximately half that of the control group. Each dot represents one fish, and at least 20 zebrafish were used per group. The data are presented as mean ± SD. P values were calculated using unpaired t test. Experiments were repeated three times. (G) Morphology of CaP axons from embryos at 48 hpf that were injected control or fam91a1 MO. All injections are performed at one cell stage of the Tg [Hb9: GFP]ml2 transgenic zebrafish embryos. Lateral views and enlarged views are shown (Scale bar, 20 μm). (H) Statistical results of the length of CaP axons in embryos treated as in G. For each group, more than 20 axons from 6 Tg [Hb9: GFP]ml2 transgenic zebrafish embryos are scored. The data are presented as mean ± SD. P values were calculated using unpaired t test. Experiments were repeated three times.

