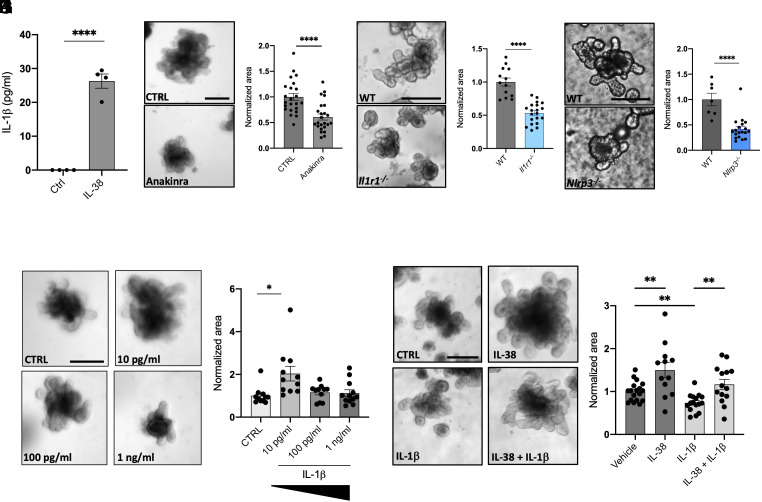
Fig. 6.
Low concentrations of IL-1β induce organoid growth. (A) IL-1β expression in the supernatants in wild-type organoids treated with 20 ng/mL IL-38 for 6 d. Comparisons between control and IL-38-treated organoids were performed using Student t test. (B) Representative pictures and (C) measurements of wild-type organoids treated with 10 μg/mL Anakinra for 6 d. Each dot represents an individual organoid, organoid cultures were produced from 3 different mice and plated in three wells for each experimental condition. (Scale bar: 200 μm.) Comparisons between control and Anakinra-treated organoids were performed using Student t test. (D) Representative pictures and (E) measurement of wild-type and Il1r1−/− organoids. Each dot represents an individual organoid; organoid cultures were produced from 3 different mice and plated in three wells for each experimental condition. (Scale bar: 200 μm.) Comparisons between control and Il1r1 knockout organoids were performed using Student t test. (F) Representative pictures and (G) measurement of wild type and Nlrp3−/− organoids. Each dot represents an individual organoid; organoid cultures were produced from 3 different mice and plated in three wells for each experimental condition. (Scale bar: 200 μm.) Comparisons between control and Nlrp3 knockout organoids were performed using Student t test. (H) Representative pictures and (I) measurements of wild-type organoids treated with 10 pg/mL, 100 pg/mL and 1 ng/mL IL-1β for 6 d. Each dot represents an individual organoid, organoid cultures were produced from 3 different mice and plated in three wells for each experimental condition. (Scale bar: 200 μm.) Comparisons between the four experimental groups were performed using one-way ANOVA. (J) Representative pictures and (K) measurements of wild-type organoids treated with vehicle, 20 ng/mL IL-38, 10 ng/mL IL-1β, and 20 ng/mL IL-38 +10 ng/mL IL-1β for 6 d. Each dot represents an individual organoid, organoid cultures were produced from 3 different mice and plated in three wells for each experimental condition. (Scale bar: 200 μm.) Comparisons between the four experimental groups were performed using one-way ANOVA. *P < 0.05; **P < 0.01; ****P < 0.0001. Mean ± SEM.

