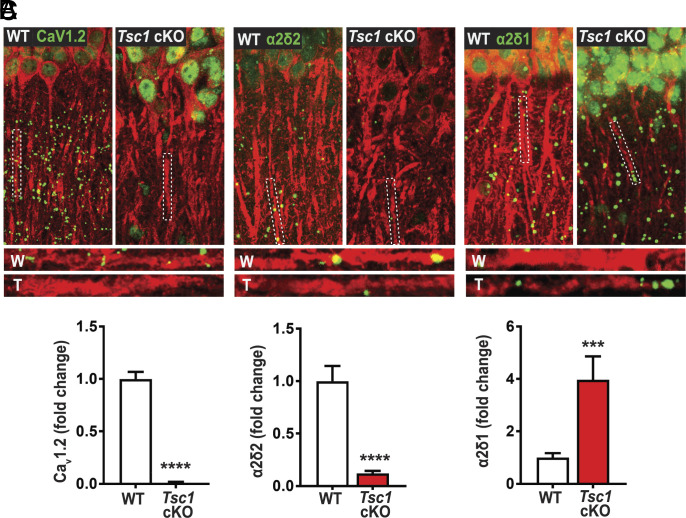
Fig. 2.
Tsc1 cKO mouse model exhibits decreased de novo protein synthesis of CaV1.2 and α2δ2, but not α2δ1. De novo protein synthesis, visualized by SUnSET-PLA (green) in hippocampal dendrites (MAP2, red). WT (W) and TSC (T) dendrites are outlined by broken lines. (A) Basal CaV1.2 protein synthesis is detected in dendrites of WT is markedly reduced in TSC, quantified below (WT = 1.00 ± 0.07, 117 total ROIs, 12 to 18 ROIs/slice, 2 to 3 slices/animal, 3 animals; Tsc1 cKO = 0.01 ± 0.01, 106 total ROIs, 12 to 18 ROIs/slice, 2 to 3 slices/animal, 3 animals). (B) α2δ2 basal new protein synthesis is detected in dendrites of WT but is attenuated in TSC as quantified below (WT = 1.00 ± 0.15, n = 77 total ROIs, 12 to 18 ROIs/slice, 2 to 3 slices/animal, 3 animals; Tsc1 cKO = 0.12 ± 0.02, n = 73 total ROIs, 12 to 18 ROIs/slice, 2 to 3 slices/animal, 3 animals). (C) Basal α2δ1 protein synthesis in dendrites of WT is lower than TSC as quantified below (WT = 1.00 ± 0.17, n = 28 total ROIs, 12 to 18 ROIs/slice, 2 to 3 slices/animal, 3 animals; Tsc1 cKO = 3.97 ± 0.90, n = 17 total ROIs, 12 to 18 ROIs/slice, 2 to 3 slices/animal, 3 animals). For representative images in A through C, CaV1.2, α2δ2, and α2δ1 puncta were dilated once using ImageJ. Bar values represent mean ± SEM. ***P < 0.001, ****P < 0.0001.

