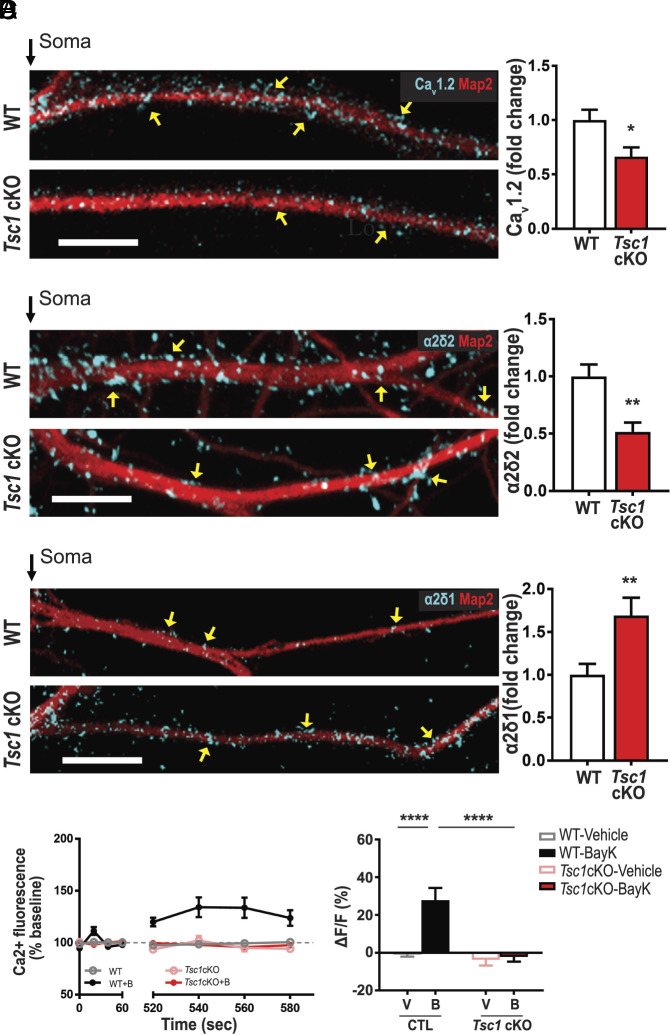
Fig. 4.
Tsc1 cKO neurons have reduced levels of calcium channel-associated proteins and L-VGCC function. (A–C) Map2 staining (red) marks dendrites. (A) CaV1.2 (blue). Compared to wild type (WT, Top), TSC1cKO dendrites (Bottom) have less CaV1.2 as quantified (Right). CaV1.2/Map2: (WT = 1.00 ± 0.10, n = 27 neurons; Tsc1 cKO = 0.66 ± 0.09, n = 23 neurons; P = 0.0129). (B) α2δ2 (blue) expression is greater in WT (Top) than Tsc1 cKO as quantified (Right). α2δ2/Map2 (control = 1.00 ± 0.10, n = 15 neurons; Tsc1 cKO = 0.52 ± 0.08, n = 12 neurons; P = 0.0017). (C) Representative WT (Top) and Tsc1 cKO (Bottom) neurons express α2δ1 (blue) in dendrites. α2δ1/Map2 (WT = 1.00 ± 0.12, n = 30 neurons; Tsc1 cKO = 1.69 ± 0.21, n = 34 neurons; P < 0.0085). (D) (Left) Average traces of calcium fluorescence before (baseline; 0 to 60 s) and after (520 to 580 s) the addition of vehicle or BayK at ~90 s. With BayK, dendritic calcium fluorescence increases in WT (black) but not in Tsc1 cKO (red). (Right) Quantification of change in fluorescence (ΔF) normalized to baseline (F). Two-way ANOVA revealed a significant main effect of treatment (F1,76 = 8.15, P = 0.0055), genotype (F1,76 = 9.64, P = 0.0027), and a significant genotype × treatment interaction (F1,76 = 6.591, P = 0.0122). WT-Vehicle (gray, −0.96 ± 1.12, n = 20 dendrites, 15 neurons) vs. WT-BayK (black, 27.92 ± 6.39, n = 14 dendrites, 11 neurons) Tsc1cKO-Vehicle (pink, −3.82 ± 2.98, n = 28 dendrites, 20 neurons) vs. Tsc1cKO-BayK (red, −2.29 ± 2.44, n = 18 dendrites, 14 neurons). Statistical tests: A through C by t test; D by two-way ANOVA, Tukey post hoc test. Bar values represent mean ± SEM. *P < 0.05, ***P < 0.001, ****P < 0.0001.

