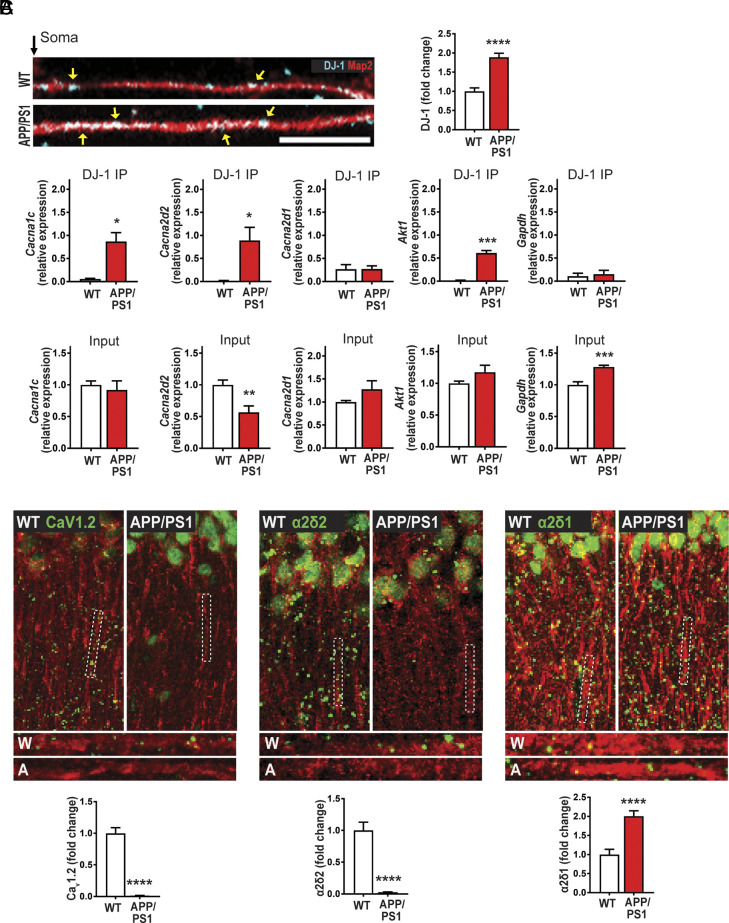
Fig. 5.
The APP/PS1 preclinical model of AD exhibits aberrant DJ-1 expression and CaV1.2 and a2d2 de novo translation. (A) In hippocampal neuronal cultures, expression of DJ-1 (blue) in dendrites (Map2, red), yellow arrows indicate puncta, is low in WT (Top) compared to APP/PS1 (Bottom) as quantified (Right). Quantification: WT = 1.00 ± 0.088, n = 133 dendrites, 48 neurons; APP/PS1 = 1.89 ± 0.10, n = 143 dendrites, 50 neurons, ****P < 0.0001. (B) (Top). qRT-PCR from DJ-1-RIP from APP/PS1 and WT animals, showing Cacna1c and Cacna2d2 bind to DJ-1. Cacna1c: WT = 0.06 ± 0.01, APP/PS1 = 0.87 ± 0.2, P = 0.01. Cacna2d2: WT = 0.02 ± 0.01, APP/PS1 = 0.89 ± 0.3, P = 0.03. Cacna2d1: WT = 0.26 ± 0.1, APP/PS1 = 0.27 ± 0.07, P = 0.99. Akt1: WT = 0.01 ± 0.01, APP/PS1 = 0.61 ± 0.05, P = 0.0004. Gapdh: WT = 0.11 ± 0.06, APP/PS1 = 0.15 ± 0.08, P = 0.71. (Bottom) qRT-PCR of 5% of the input from APP/PS1 or WT. Cacna1c: WT = 1 ± 0.06, APP/PS1 = 0.91 ± 0.14, P = 0.61. Cacna2d2: WT = 1 ± 0.08, APP/PS1 = 0.57 ± 0.10, P = 0.0042. Cacna2d1: WT = 1 ± 0.04, APP/PS1 = 1.3 ± 0.22, P = 0.23. Akt1: WT = 1 ± 0.04, APP/PS1 = 1.2 ± 0.11, P = 0.14. Gapdh: WT = 1 ± 0.05, APP/PS1 = 1.28 ± 0.03, P = 0.0001. n = 3 technical replicates, 3 independent mice. t test, two-tailed. (C) De novo protein synthesis, SUnSET-PLA (green) in dendrites (MAP2, red). (Left) CaV1.2 is basally translated in WT but is repressed in APP/PS1 as quantified in rightmost panel. Quantification (Bottom): WT = 1.00 ± 0.09, n = 110 total ROIs, 15 to 21 ROIs/slice, 3 slices/animal, 3 animals; APP/PS1 = 0.01 ± 0.003, n = 114 total ROIs, 15 to 21 ROIs/slice, 3 slices/animal, 3 animal. (Middle) Basal translation of α2δ2 is robust in WT but is attenuated in APP/PS1 as quantified in rightmost panel. Quantification (Bottom): WT = 1.00 ± 0.13, n = 100 total ROIs, 15 to 21 ROIs/slice, 3 slices/animal, 3 animals; APP/PS1 = 0.03 ± 0.005, n = 100 total ROIs, 15 to 21 ROIs/slice, 3 slices/animal, 3 animals. (Right) New synthesis of α2δ1 protein in WT is lower than APP/PS1 as quantified in rightmost panel. Quantification (Bottom): WT = 1.00 ± 0.14, n = 104 total ROIs, 15 to 21 ROIs/slice, 3 slices/animal, 3 animals; APP/PS1 = 2.00 ± 0.14, n = 112 total ROIs, 15 to 21 ROIs/slice, 3 slices/animal, 3 animals. For representative images, CaV1.2, α2δ2, and α2δ1 puncta were dilated once using ImageJ. Statistical tests: A and C by Student’s t test. Bar values represent mean ± SEM. ****P < 0.0001.

