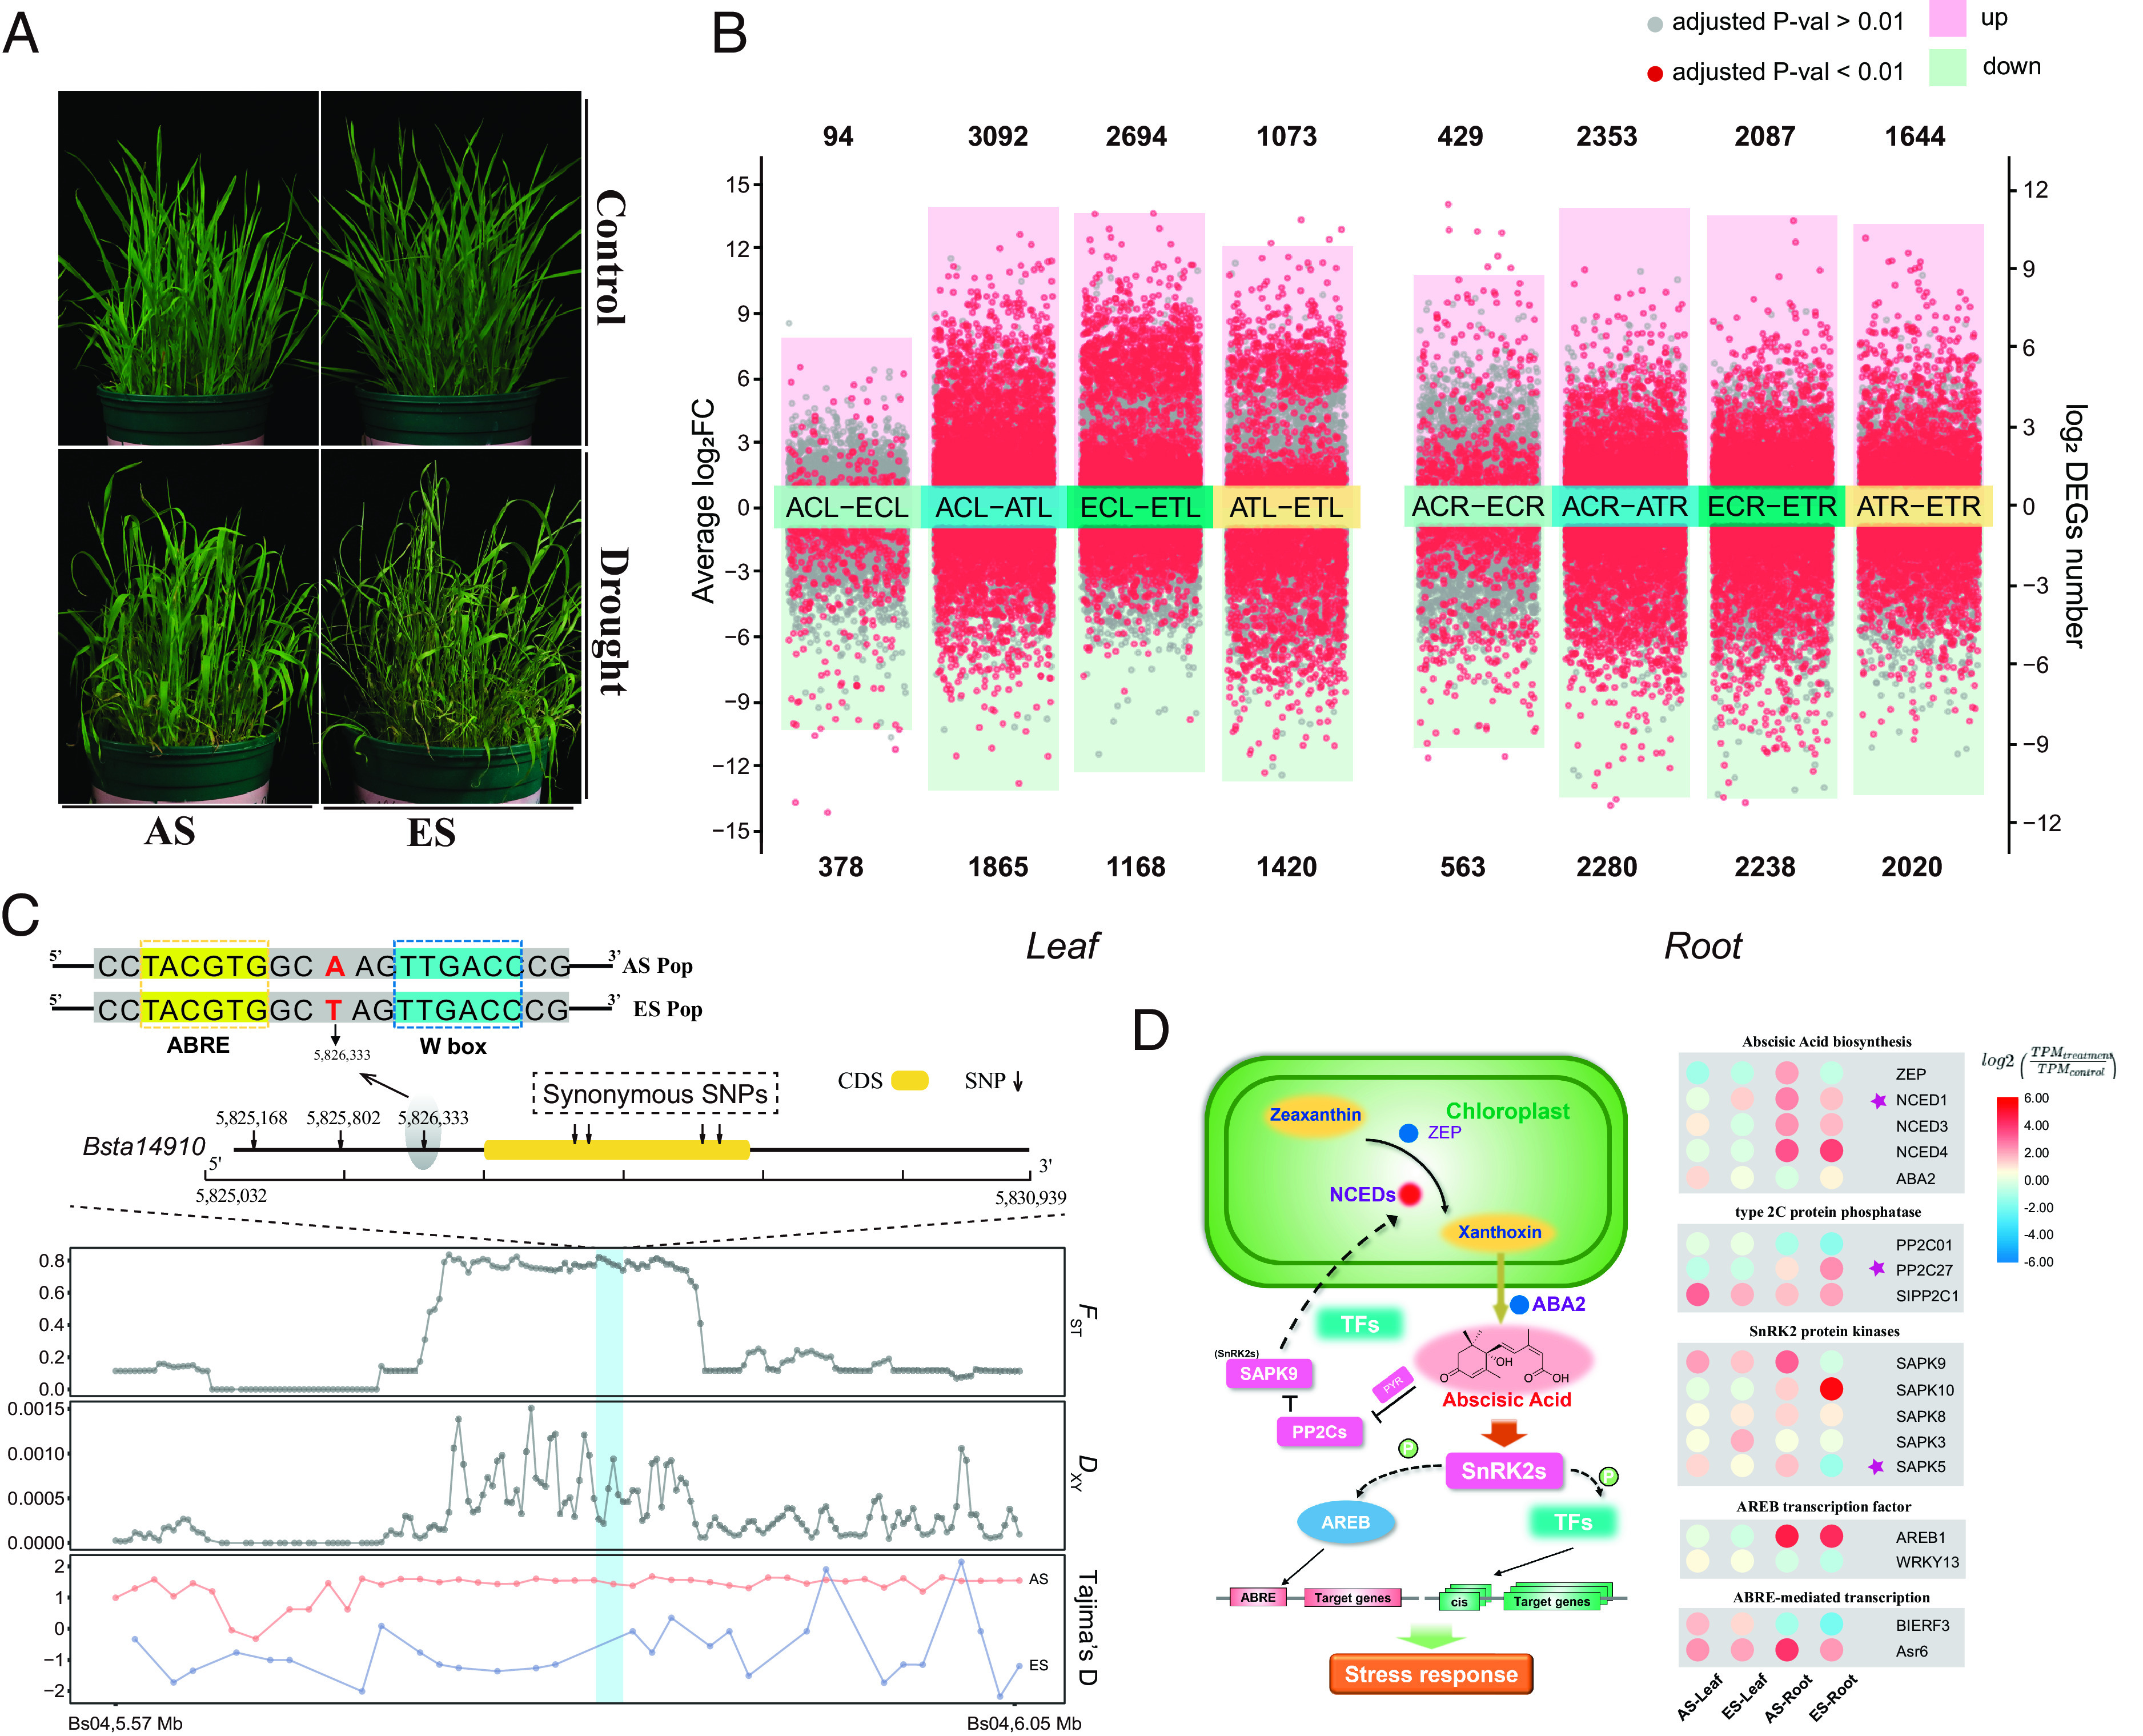
Fig. 3.

Phenotypic, transcriptomic, and genetic responses related to drought stress conditions of B. stacei plants from AS and ES populations. (A) Above-ground phenotypes of plants from AS and ES populations grown under drought and well-watered (control) conditions. (B) Up-regulated and down-regulated differentially expressed genes (DEGs) in leaf and root tissues from intra- and inter-AS and ES population comparisons; adjusted P-values < 0.01 and >0.01 are indicated by red and gray dots, respectively. (C) Genetic structure and SNP variants located between ±2 kbp (upstream and downstream) of gene Bsta14910 (ortholog of rice OsNCED1) in chromosome Bs04. Population parameters FST, DXY, and Tajima’s D of AS and ES populations. The bright blue bar in the plots represents the windows containing Bsta14910 and its polymorphisms. (D) Different expression patterns of ABA signaling pathway genes in B. stacei leaf and root tissues of samples from the AS and ES populations at ECI under drought stress treatment. Heatmaps of differential expression patterns of genes of AS and ES leaf and root tissue samples for relevant genes of the ABA signaling pathway routes. Each cell represents the Log2 fold change of DEGs between drought (treatment) and well-watered (control) conditions (TPMTreatment/TPMControl); the color codes for these values are indicated in the corresponding chart. Genes located in selective regions are marked with a star.
