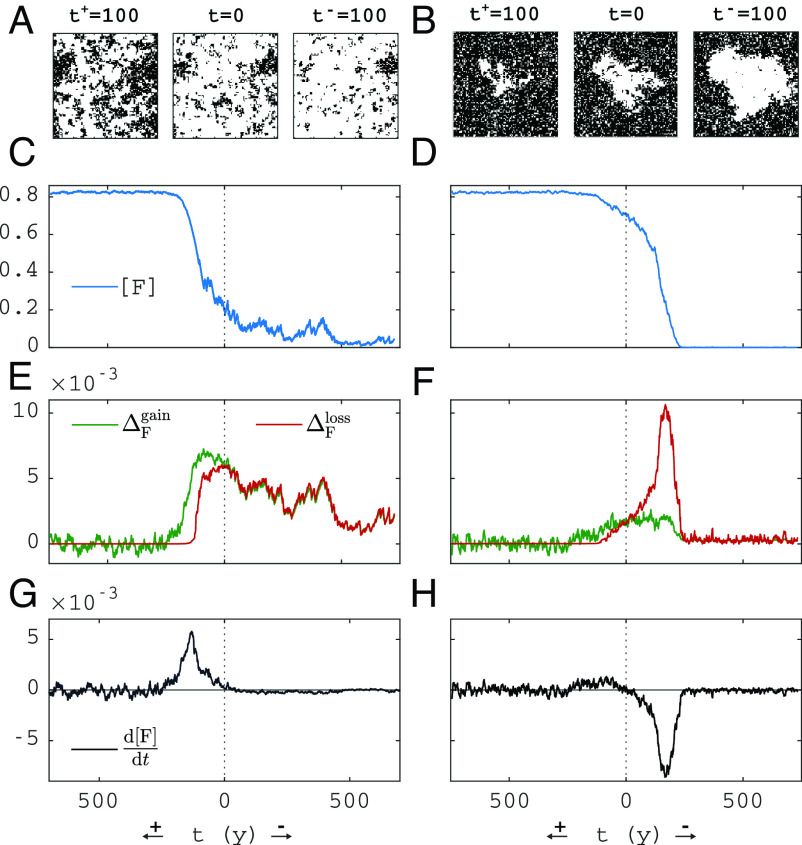
Fig. 3.
Rate of change according to Eq. 9. (A and B) Spatial snapshots at indicated times, (C and D) time series of , (E and F) time series of , , (G and H) time series of the right-hand side of Eq. 9 (gain minus loss). At , the simulation is started on the saddle (on the left, and on the right, , see blue and red circles in Fig. 2). Toward the left (along ), a simulation that tips up and toward the right (along ) a simulation that tips down is shown. Parameters are shown in Table 1. Columns correspond to leftmost and rightmost vertical dashed lines in Fig. 2 ( and ). Domain size: 100 100 cells.

