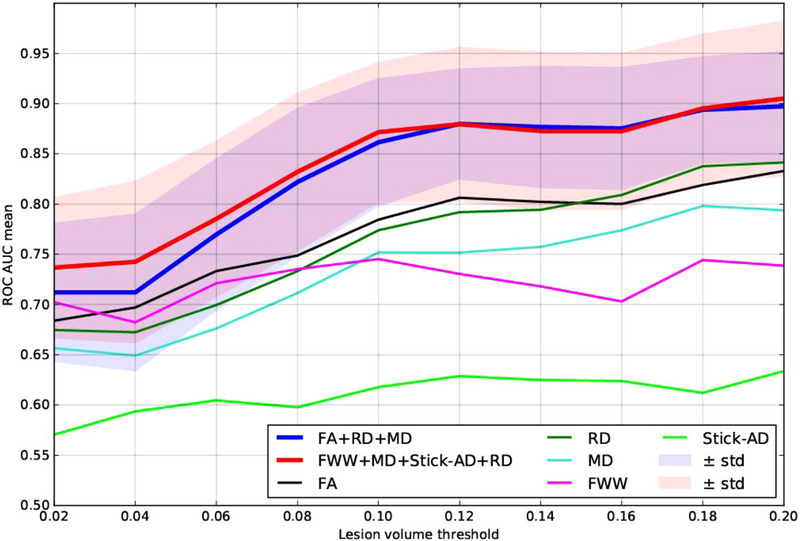
FIGURE 6.

Overlays of receiver operating characteristic (ROC) area under the curve (AUC) score predicted by linear discriminant analysis (LDA) as a function of lesion volume percentage in the corresponding vertebral level for the best combinations: (fractional anisotropy [FA], mean diffusivity [MD], radial diffusivity [RD]) and (free water weight [FWW], MD, stick axial diffusivity (Stick‐AD), RD). STD, standard deviation.
