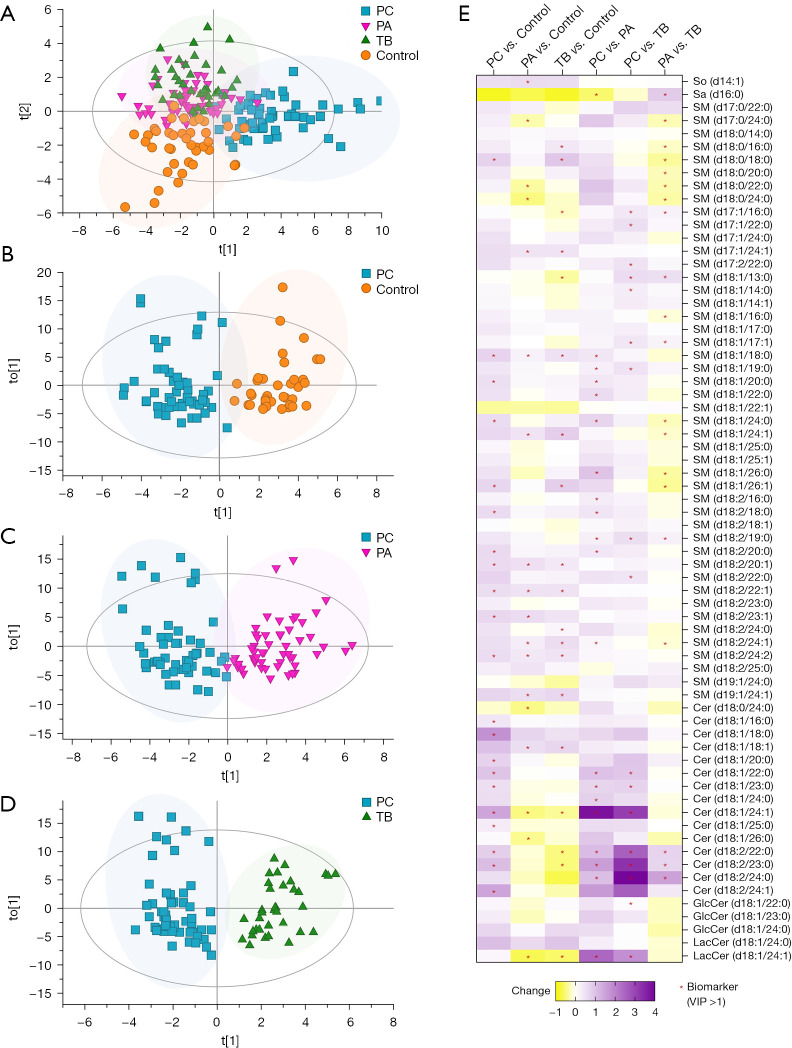
Figure 2.
Comparison of serum SPLs between different groups of participants. OPLS-DA score plots show discrimination between (A) all participant groups, including control (test cohort, n=20), PC (test cohort, n=27), PA (n=27), and TB (n=18) (R2X =0.806, R2Y =0.543, Q2 =0.356) groups; (B) control (test cohort) and PC (test cohort) (R2X =0.796, R2Y =0.823, Q2 =0.544) groups; (C) PC (test cohort) and PA (R2X =0.724, R2Y =0.784, Q2 =0.645) groups; and (D) PC (test cohort) and TB (R2X =0.767, R2Y =0.854, Q2 =0.714) groups. (E) A heatmap plot displays the change in each SPL between groups, including PC vs. control, PA vs. control, TB vs. control, PC vs. PA, PC vs. TB, and PA vs. TB; biomarkers (VIP >1) between the groups are labelled with a red asterisk (*). Change (PC vs. control) = (level in PC − level in control)/level in control. PC, patients with pulmonary cryptococcosis; PA, patients with pulmonary aspergillosis; TB, patients with pulmonary tuberculosis; control, healthy controls; So, sphingosine; Sa, sphinganine; SM, sphingomyelin; Cer, ceramide; GlcCer, glucosylceramide; LacCer, lactosylceramide; VIP, variable importance in the projection; SPLs, sphingolipids; OPLS-DA, orthogonal partial least squares discriminate analysis.

