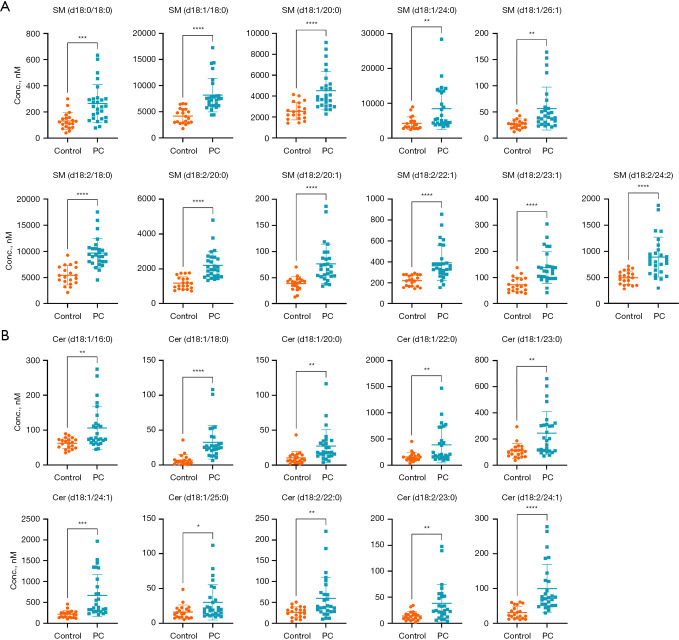
Figure 3.
Potential biomarkers for differentiating PC patients from controls. The (A) 11 SMs and (B) 10 Cers differentially expressed in PC patients. Each dot represents a participant sample. *, P<0.05; **, P<0.01; ***, P<0.001; ****, P<0.0001. SM, sphingomyelin; control, healthy controls; PC, pulmonary cryptococcosis; Cer, ceramide.

