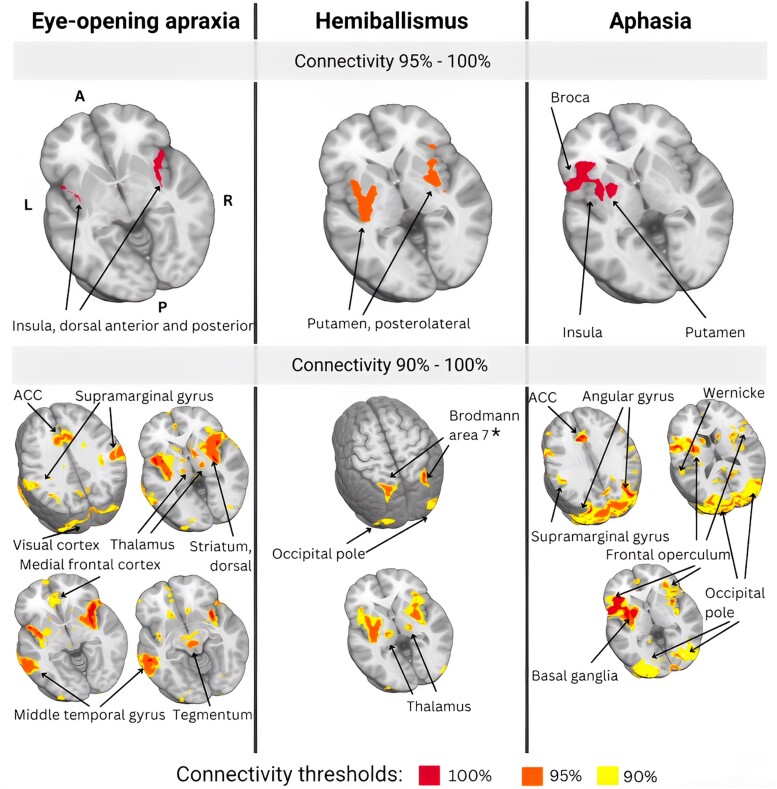
Figure 5.
Comparative lesion network overlaps: EOA, hemiballismus, and aphasia mapping. The top panel displays areas of highest overlap (95–100%) between anatomic lesions and functional mapping results, while the bottom panel depicts areas of partial overlap (90%–100%). EOA: in patients with EOA, all (100%) anatomic lesions mapped onto the bilateral insula, particularly dorsal anterior and posterior portions. In addition, 95% of lesions mapped onto the middle temporal gyrus, and over 90% onto the anterior cingulate cortex, post-central gyrus, thalamus, superior parietal lobule, medial prefrontal cortex, supramarginal gyrus, dorsal striatum, visual cortex, right posterior cerebellar hemisphere and tegmentum (oculomotor nucleus). Overall, lesion network mapping reveals the importance of the insula as a key node of the EOA network. Hemiballismus: in patients with hemiballismus, over 95% of lesions mapped onto the bilateral putamen, particularly the posterolateral portion. Over 90% of lesions also mapped onto the posterior parietal cortex and precuneus (Brodmann area 7), precentral gyrus (particularly Brodmann Area 6), thalamus, supramarginal gyrus, anterior cingulate cortex and occipital pole. Aphasia: in patients with aphasia, all lesions mapped onto brain regions involved in language processing, specifically the left frontal operculum, particularly Broca’s area, left insula, supplemental motor cortex, left putamen and occipital pole, including primary visual and visual associative cortex, and lingual gyrus. Functional maps are presented in neurologic convention and directional abbreviations indicate brain orientation: A, anterior; ACC, anterior cingulate cortex; L, left; P, posterior; R, right. *Part of the posterior parietal lobe.

