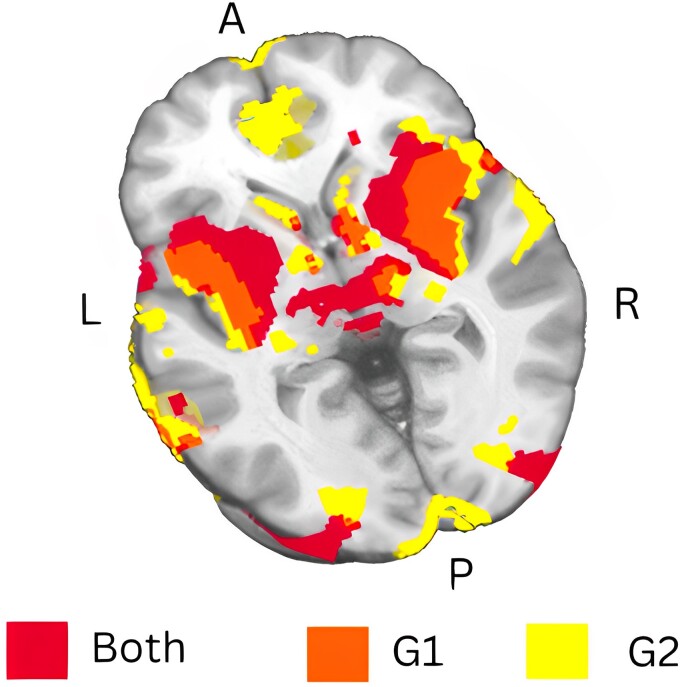
Figure 6.
Consistency in lesion connectivity patterns of EOA across subgroups. This figure shows the results of a sensitivity analysis for two subgroups of EOA patients: G1 (n = 14) and G2 (n = 13). Both groups display a consistent lesion network connectivity pattern, visualized at an overlap threshold of 90%. Functional maps are presented in neurologic convention and directional abbreviations indicate brain orientation: A, anterior; ACC, anterior cingulate cortex; L, left; P, posterior; R, right.

