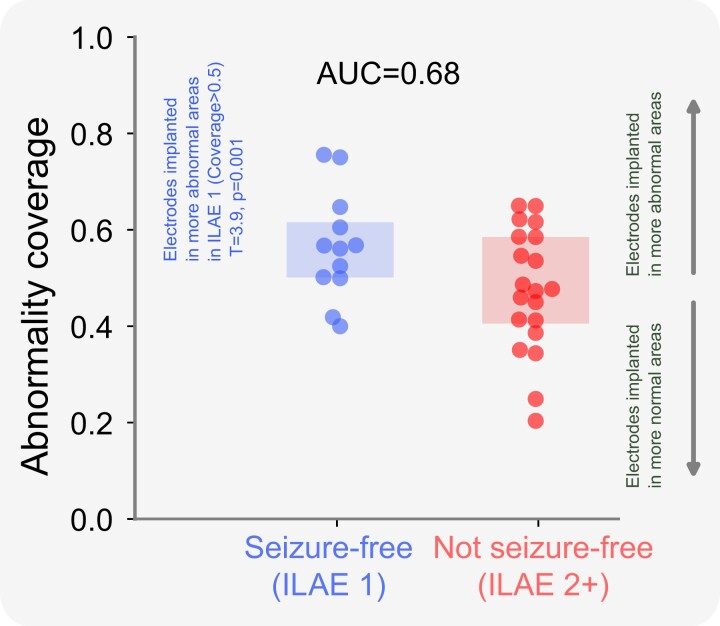
Figure 3.
Surgical outcome separability of the abnormality coverage at a group level. The boxplot shows the abnormality coverage measure for seizure-free (ILAE 1) and non–seizure-free subjects (ILAE 2+). Each data point corresponds to an individual subject. Seizure-free subjects are significantly >0.5 indicating coverage in regions with high MEG abnormality (T , P = 0.001). This effect was not present for ILAE 2+ patients. Differences between each group of individuals relative to 0.5 were estimated using a one-tailed one sample t-test. One-tailed tests were used as clear preconceived hypotheses were provided. AUC = area under the receiver operating characteristic curve.

