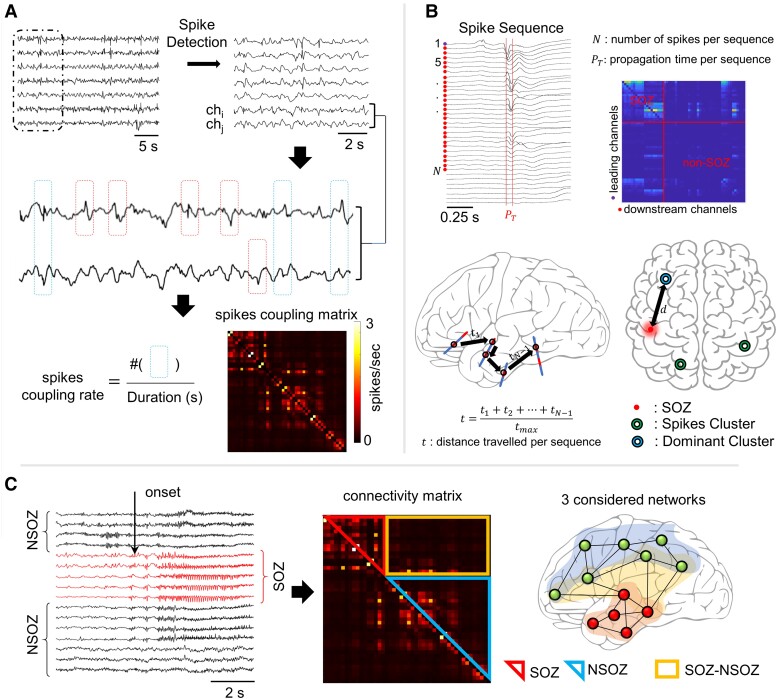
Figure 1.
Analysis pipeline. (A) Intracerebral EEG signals are fed to an automatic spike detector (based on spectral whitening) to detect spikes. For each pair of channels chi and chj coupled spike rate was computed by counting the number of times two spikes appeared synchronously on both channels in a window of 100 ms and dividing by total duration of the signal. Spikes appearing asynchronously on pairs of electrodes were not included. The value at column i and row j represents the coupled spike rate in spikes/second for channels of indices i and j. (B) Spike sequences are extracted from EEG recordings where the channel whose spike that first appears in time in a particular sequence is considered a leading channel and all the other participating contacts are considered downstream channels. The maximum propagation time allowed ) was set to 50 ms, all downstream channels should have spikes appearing in a window of 15 ms from the previous sequence-participating channel. Leading-downstream matrices were constructed where each value represents the number of times channel appeared in a spike sequence lead by channel i. Trajectory distance t travelled by a propagating spike was calculated by adding elementary Euclidean distances between channels with spikes in a particular sequence. Spike sequences were clustered using k-means algorithm, and distance d between dominant cluster and seizure onset zone (SOZ) was calculated. (C) Classification of connectivity matrices values. Channels first showing seizure onset were classified as seizure onset zone channels, i.e. SOZ. All the other channels were considered non-seizure onset zone channels (NSOZ). The values in each connectivity matrix were classified into three networks, intra-SOZ, intra-NSOZ and inter-SOZ–NSOZ.

