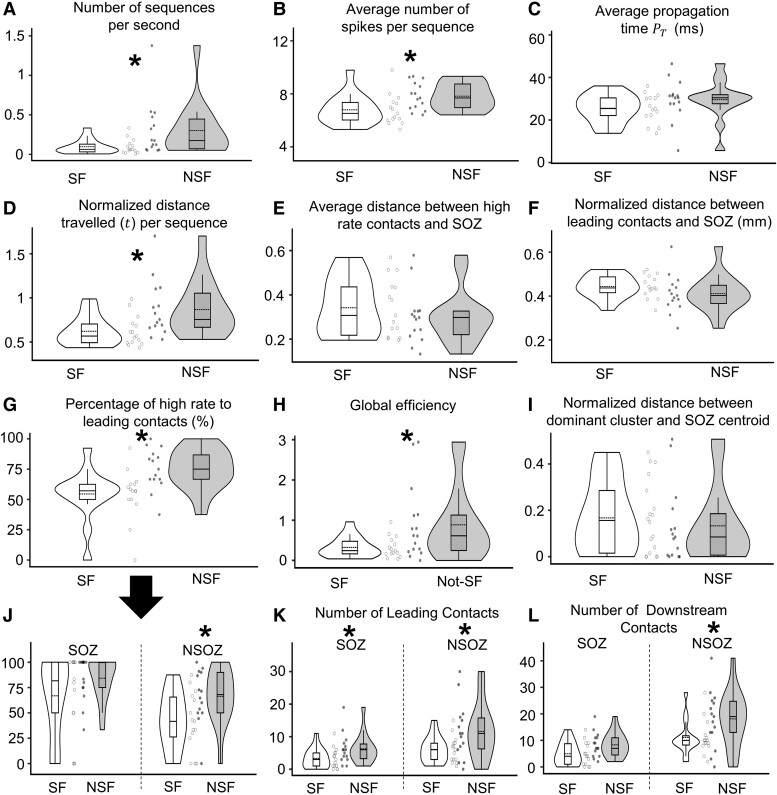
Figure 3.
Comparison of spike propagation measures between seizure-free (SF) and not seizure-free (NSF) patients. Violin plots of the number of spike sequences per second (A; Wilcoxon, P = 0.020, Cliff’s d = 0.502), average number of spikes per sequence (B; Wilcoxon, P = 0.011, d = 0.547), average propagation time , which is the time between the occurrence of the leader spike and the last spike in the sequence (C), normalized Euclidean distance (t) (D; Wilcoxon, P = 0.009, d = 0.145), average normalized distance between channels with the highest 10% rates and the centroids of the seizure onset zone (SOZ) (E), same as panel E but for the leading channels (F), percentage of the leading contacts that also have high spike rates (G; Wilcoxon, P = 0.003, d = 0.649), global efficiency (inverse of shortest path length) derived from the leading-downstream matrix (H; Wilcoxon, P = 0.014, d = 0.392), normalized distance between dominant spike cluster (cluster that has the highest number of sequences) and the centroid of the SOZ (I), same as panel G, but values for SOZ and non-seizure onset zone or NSOZ (J; Wilcoxon, P = 0.017, d = 0.673 for NSOZ), number of leading channels with respect to the SOZ and NSOZ (K; Wilcoxon, P = 0.041, 0.043 and d = 0.781, 0.356 for SOZ and NSOZ, respectively), and number of downstream channels in SOZ and NSOZ (L; Wilcoxon, P = 0.036 and d = 0.435 for NSOZ). In all plots, each datapoint corresponds to a measure from one patient. Asterisks () represent significant differences between SF and NSF groups. n = 30 was used in all comparisons.

