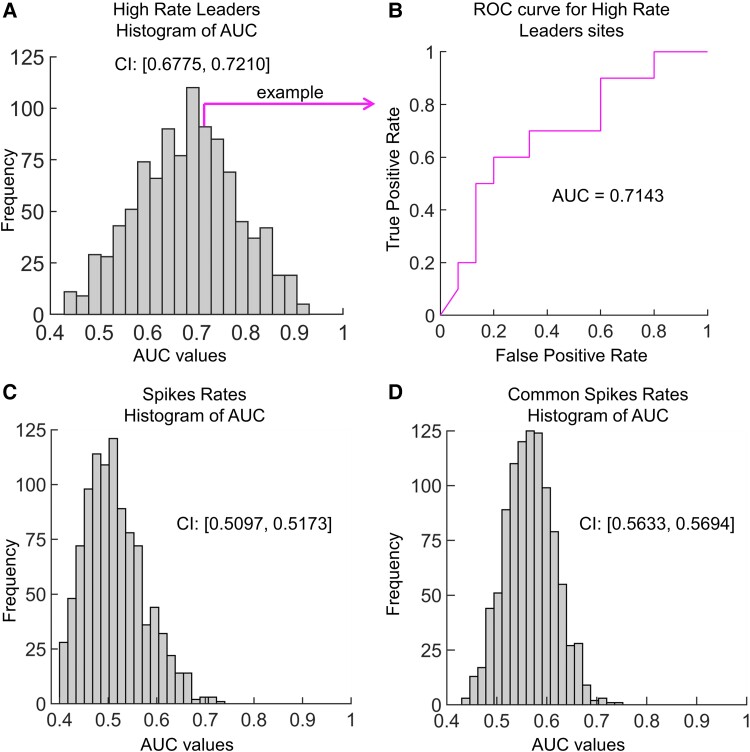
Figure 4.
Receiver operating characteristic (ROC) curves to predict seizure outcome. (A) Histogram of area under curve (AUC) values for 1000 iterations of the feedforward model using high-rate leaders (hiRL) to predict seizure outcome. Each iteration used a leave-one-out method where 24 randomly selected patients were used to train and 1 patient was used to test the model. (B) ROC curve illustrating one iteration, which had an AUC value of 0.7143. (C and D) Same as panel A but using individual (C) and coupled spike rates (D). In these analyses, the leave-one-out method used 29 randomly selected patients to train and 1 patient to test the model. The confidence interval (CI) is shown besides each histogram.

