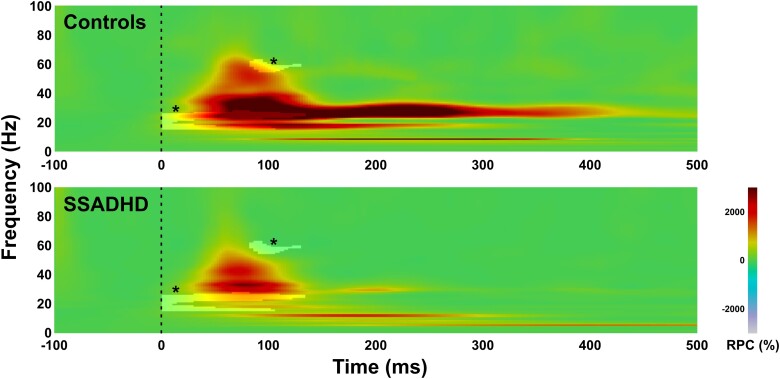
Figure 2.
Time–frequency analysis for evoked cortical responses in contralateral S1 for healthy controls (n = 10) and patients with SSADHD (n = 18). Grant average of relative power changes with respect to baseline (in %) at the virtual channel contralateral to the S1 for healthy children (upper panel) and patients with SSADHD (lower panel). Highlighted areas with an asterisk (*) indicate statistically significant differences between the two groups [Monte Carlo permutation tests (5000 permutations); corrected for multiple comparisons; P < 0.01]. RPC (%), relative power change.

