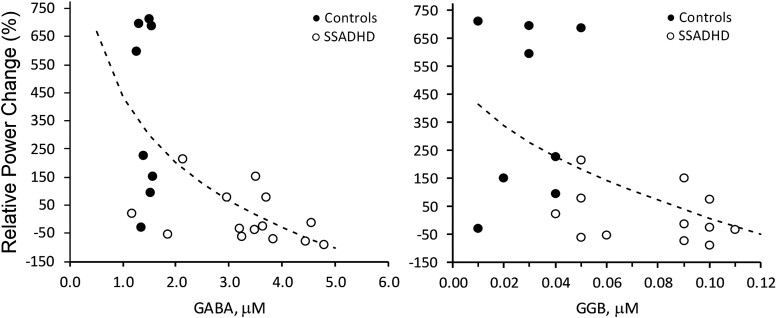
Figure 4.
Correlation of relative power changes in gamma-band with plasma GABA and GGB. Correlation of relative power changes in gamma band with plasma GABA (left; P < 0.0026, r = −0.61) and GGB (right; P < 0.0074, r = −0.55). Relative power change, change in the power of the EEG signal (%) during the active period (after pneumatic stimulation) compared with the baseline period (before stimulation). Dotted lines = best fit: SQRT(X) (left), LOG(X) (right). Regression analysis was performed to obtain regression coefficients and P-values.

