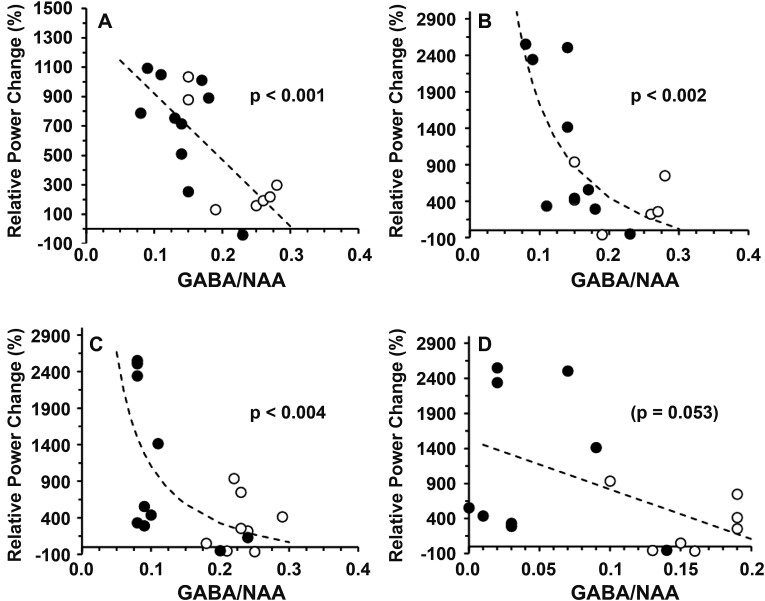
Figure 5.
Relationship between relative power changes and brain GABA/NAA. Relationship between the relative power changes (%) and 1H-MRS–GABA/NAA ratios in patients with SSADHD (○) and controls (●) for beta band (A: basal ganglion) and gamma band (B: basal ganglion; C: posterior cingulate gyrus; D: occipital cortex). Dotted lines = best fit: linear (A, D), reciprocal (X) (B, C). Regression analysis was performed to obtain regression coefficients and P-values.

