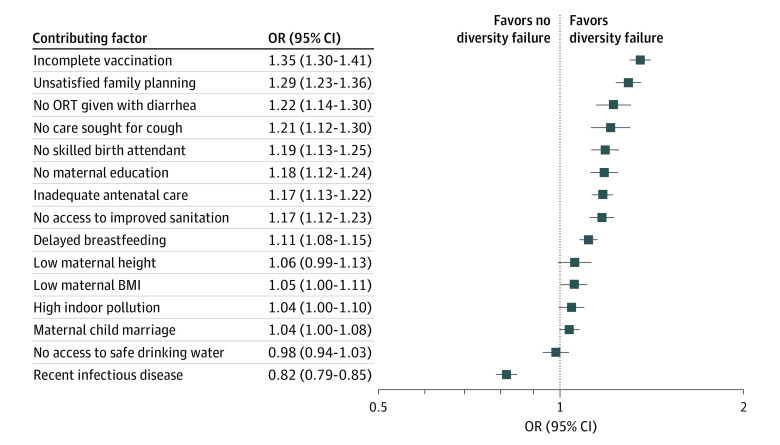
Figure 4. Associations Between Contributing Factors and Dietary Diversity Failure.
Includes 98 842 participants in 51 countries. Squares represent point estimates of odds ratios (ORs) associated with dietary diversity failure. Contributing factors include immediate and underlying determinants of malnutrition that were available in the Demographic and Health Surveys. All specifications include country and survey year fixed effects as well as household, child, and mother control variables. Error bars indicate 95% CIs. BMI indicates body mass index (calculated as weight in kilograms divided by height in meters squared); ORT, oral rehydration therapy.

