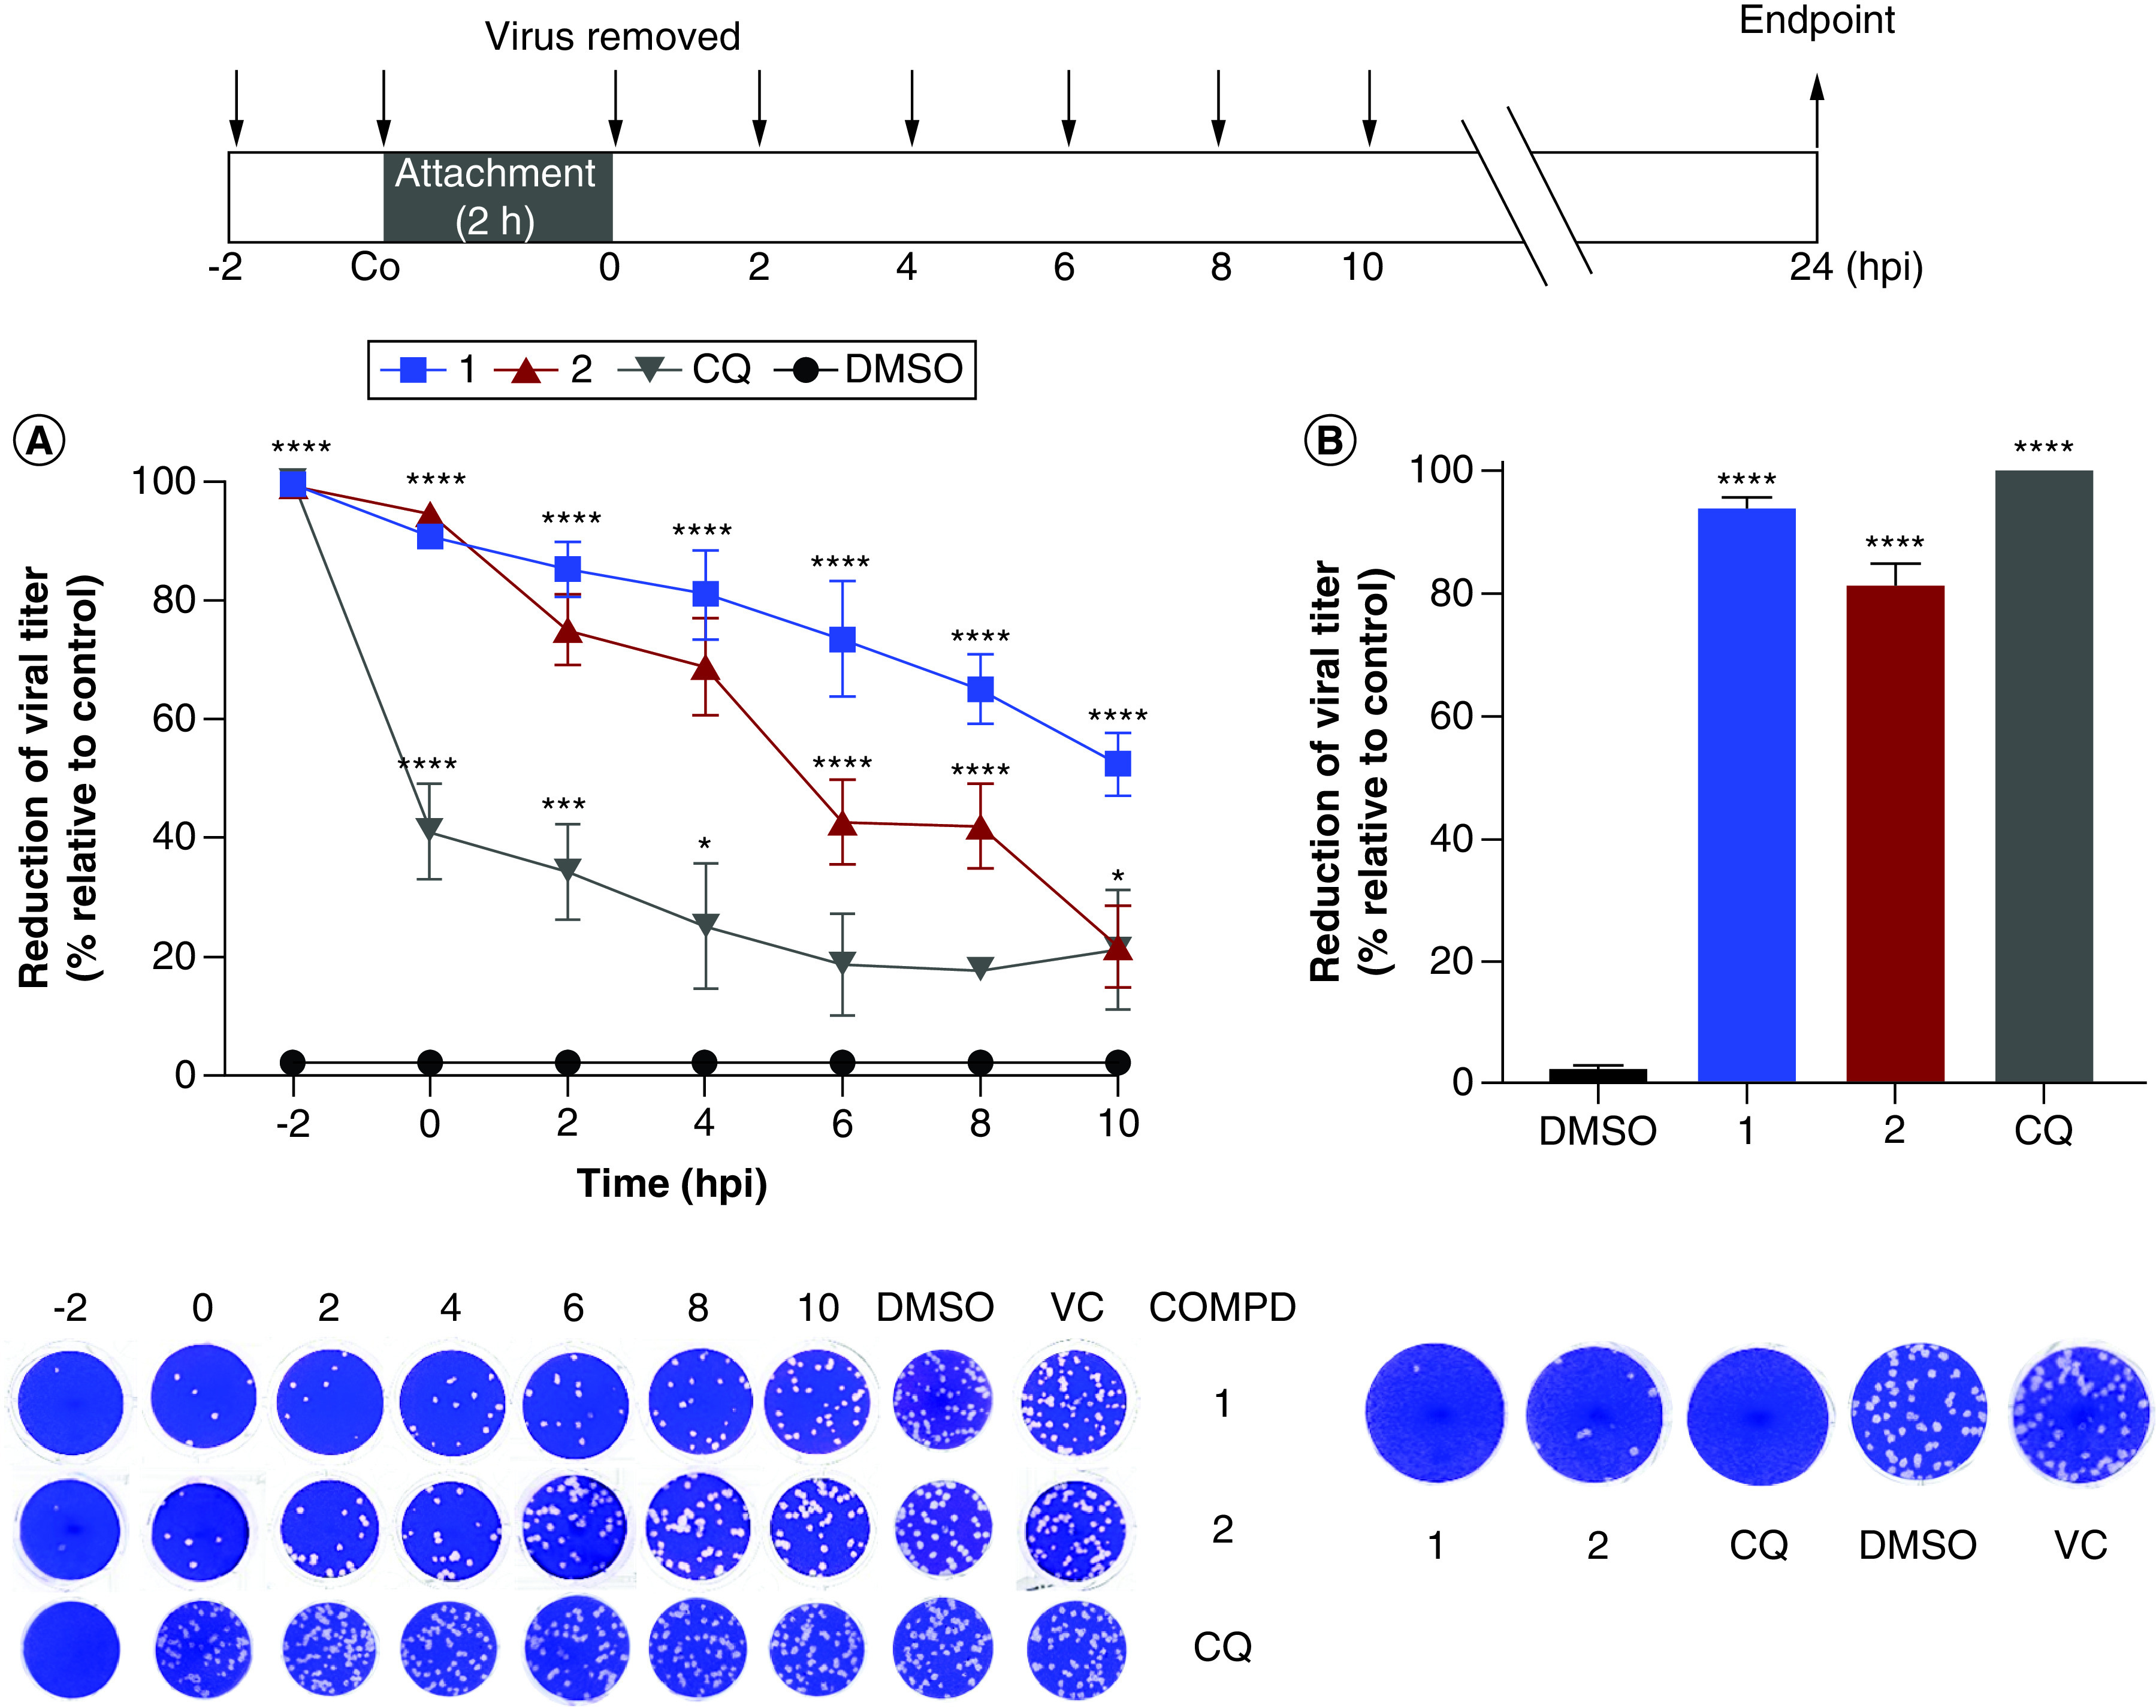
Figure 2. . Antiviral activity of the 1,4-disubstituted-1,2,3-triazole derivatives and chloroquine after treatment at different times during Chikungunya virus infection (MOI 1.0) in Vero cells according to the superior scheme.

Compounds (100 μM) were added (A) at different times pre- or post-infection, or (B) during the virus attachment period (co-treatment). At 24 hpi, cells were lysed and supernatants were collected. Inhibitory rates were determined by comparison to the infected and untreated cell control (VC) using plaque assays. Representative viral plaques of Vero cells are shown. Data are expressed as mean ± standard deviation (n = 3). One-way ANOVA and Tukey post-test were employed to evaluate statistical significance relative to DMSO-treated (0.2%) control (*p < 0.05; ***p < 0.001; ****p < 0.0001).
CHIKV: Chikungunya virus; COMPD: Compound; CQ: Chloroquine; DMSO: Dimethyl sulfoxide; VC: Virus control.
