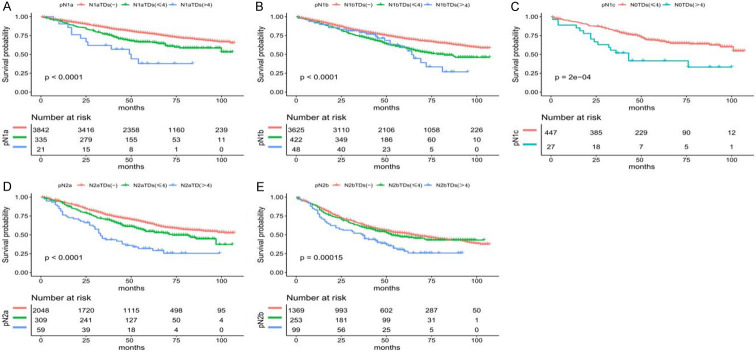
Figure 4.
Kaplan-Meier curve shows the difference in survival of tumor deposit groups under the same lymph node stage in patients with stage III colon cancer. A. The overall survival (OS) of patients with different numbers of TDs in the pN1a stage. B. The OS of patients in the pN1b stage. C. The OS of patients in the pN1c stage. D. The OS of in the pN2a stage. E. The OS of patients in the pN2b stage.

