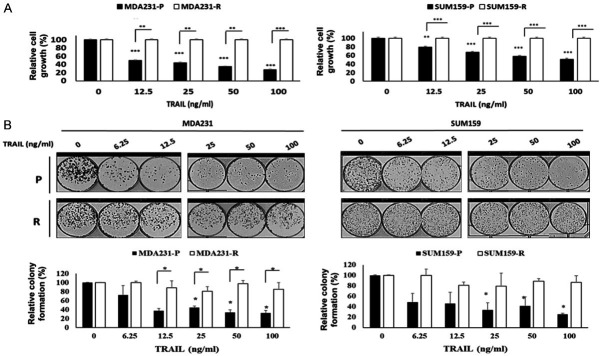
Figure 1.
TRAIL sensitivity of TNBC cells. A. The MTT assay was performed to determine relative cell growth of MDA231 (left) and SUM159 (right) cells treated with the indicated doses of TRAIL for 48 h. B. Colony formation assays and quantification of MDA231 (left) and SUM159 (right) cells treated with the indicated doses of TRAIL for 48 h. Top: Colony formation assay. Bottom: Densitometry bar graph depicting relative colony formation. P, parental; R, resistant to TRAIL. In the bar graphs, data are represented as mean ± SD, where the error bars denote the standard deviation (SD). *P < 0.05; **P < 0.01; ***P < 0.001 by Student’s t-test.

