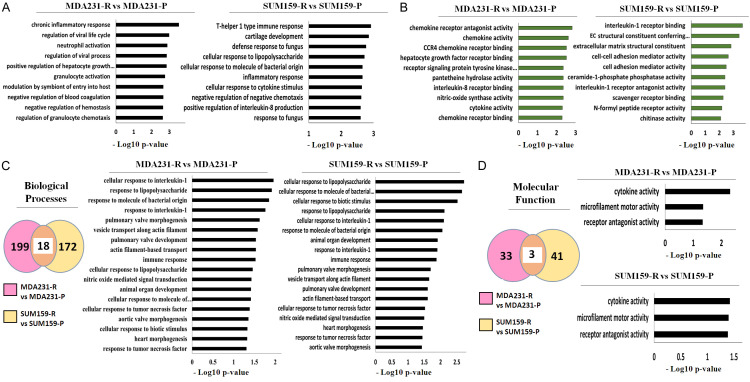
Figure 3.
Gene ontology analysis shows that DEGs have immune-related functional annotations and that TRAIL-resistant TNBC cells have similar immune-related gene ontologies. (A, B) Gene ontology analysis of the top 30 DEGs in each pair of cell lines for (A) biological processes and (B) molecular functions. Left: MDA231 cells. Right: SUM159 cells. (C, D) Meta-analysis of all DEGs in each cell line pair for (C) biological processes and (D) molecular functions. Left: Venn diagram of shared gene ontologies (C, D). Middle: Clustered bar graph for MDA231 cells (C). Right: Clustered bar graph for SUM159 cells (C). Upper Right: Clustered bar graph for MDA231 cells (D). Lower Right: Clustered bar graph for SUM159 cells (D). DEG, differentially expressed gene; P, Parental; R, resistant to TRAIL.

