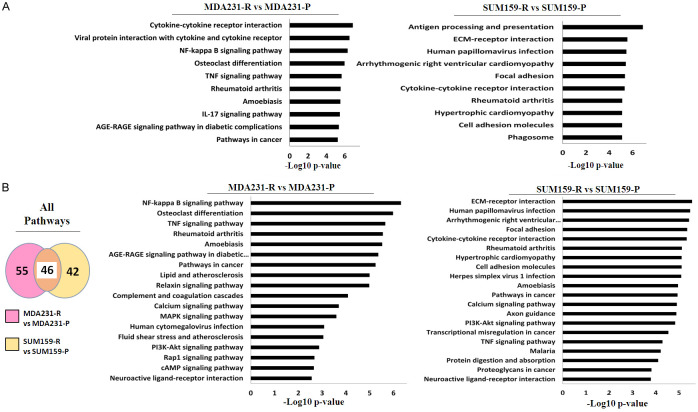
Figure 4.
KEGG analysis shows that DEG alter immune-related canonical pathways and that TRAIL-resistant TNBC cells share altered inflammatory pathways. A. Kyoto Encyclopedia of Genes and Genomes (KEGG) analysis of altered canonical pathways by the top 30 DEGs in each cell line pair. Left: Clustered bar graph MDA231 cells. Right: Clustered bar graph SUM159 cells. B. Meta-analysis of shared altered canonical pathways using KEGG of all DEGs in each pair of cell lines. Left: Venn diagram. Middle: Clustered bar graph MDA231 cells. Right: Clustered bar graph SUM159 cells. DEG, differentially expressed gene; FC, fold change; P, Parental; R, resistant to TRAIL.

