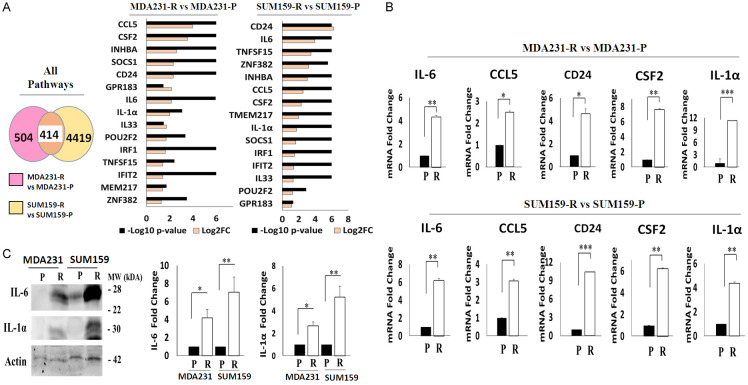
Figure 5.
TRAIL-resistant TNBC cells have similar inflammatory genes. A. Meta-analysis of shared DEGs in each cell line pair. Left: Venn diagram. Middle: Clustered bar graph for MDA231 cells. Right: Clustered bar graph for SUM159 cells. B. RT-PCR of IL-6, CCL5, CD24, CSF2, IL-1α. Upper: MDA231 cells. Lower: SUM159 cells. C. Western blot of IL-6 and IL-1α in MDA231 and SUM159 cells. Actin was used as a loading control. All experiments are representative of three independent experiments. Individual mRNA expression levels were normalized to GAPDH. DEG, differentially expressed gene; P, parental; R, resistant to TRAIL. In the bar graphs, data are represented as mean ± SD, where the error bars denote the standard deviation (SD). *P < 0.05; **P < 0.01; ***P < 0.001 by Student’s t-test.

