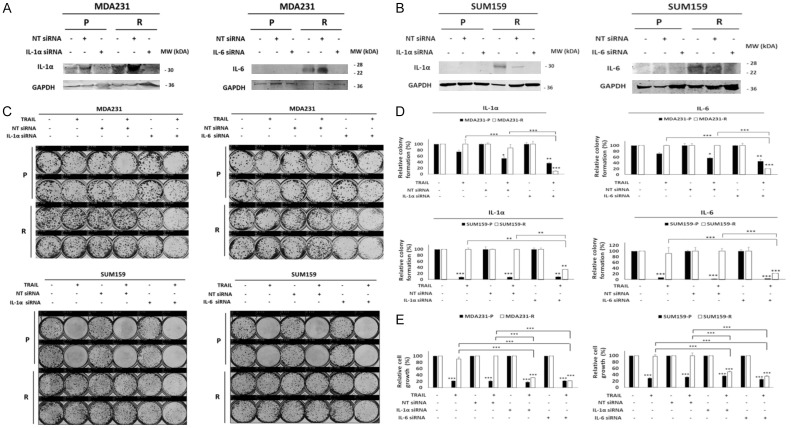
Figure 6.
Knockdown of IL-6 and IL-1α increases the sensitivity of TRAIL. MDA231 and SUM159 cells were transfected with IL-6, IL-1α, or nontarget siRNAs for 72 H. (A, B) Western blot of IL-6 and IL-1α in MDA231 (A) and SUM159 (B) cells. (C) Colony formation assay of the resulting MDA231 and SUM159 cells transfected with IL-6, IL-1α, or nontarget siRNA and treated with TRAIL (50 ng/ml) for 72 h. Upper: MDA231 cells. Lower: SUM159 cells. (D) Densitometry bar graph depicting relative colony formation. Upper: MDA231 cells. Lower: SUM159 cells. Left: IL-1α. Right: IL-6. (E) MTT assay was performed to determine relative cell growth in MDA231 (left), and SUM159 (right) cells transfected with IL-1α, IL-6, or nontarget siRNA and treated with TRAIL (50 ng/ml) for 72 h. GAPDH was used as a loading control. IL, interleukin; NT, nontarget; P, parental; R, resistant to TRAIL. In the bar graphs, data are represented as mean ± SD, where the error bars denote the standard deviation (SD). *P < 0.05; **P < 0.01; ***P < 0.001 by Student’s t-test.

