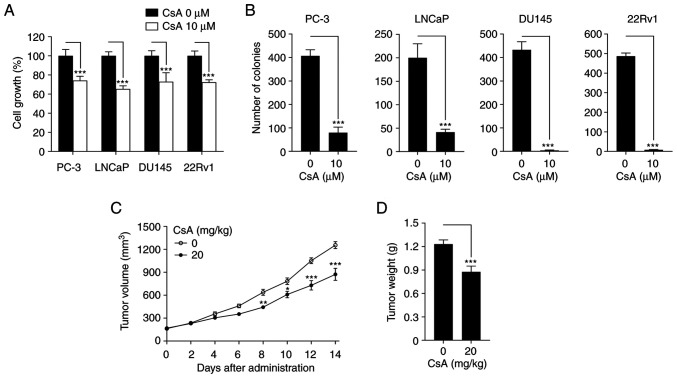
Figure 1.
CsA inhibits prostate cancer growth. (A) PC-3, LNCaP, DU145 and 22Rv1 cells were treated with 10 µM CsA for 48 h prior to MTT analysis. Cell growth was expressed as a relative value compared with that of vehicle-treated group which was set to 100%. The data were expressed as the mean ± SEM (n=4) ***P<0.005. (B) Each cell was treated with 10 µM CsA for 9 days (once every 3 days), after which colony formation was assessed. The data were expressed as the mean ± SEM (n=3) ***P<0.005. (C) Tumor volumes were recorded twice (every other day) for 14 days. The figures show the mean ± SEM (n=5) *P<0.05; **P<0.01; ***P<0.005. (D) At 14 days after xenograft implantation, the mice were sacrificed to determine tumor weight. The figures show the mean ± SEM (n=5) ***P<0.005. CsA, cyclosporin A.

