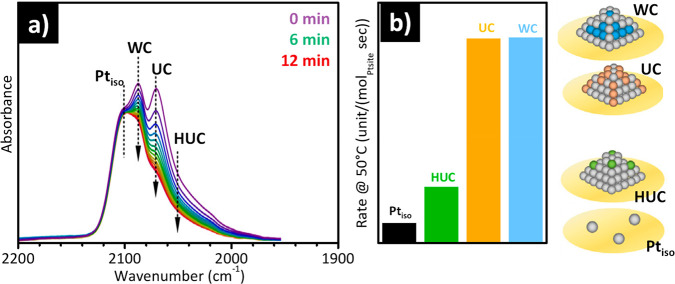
Figure 18.
Operando IR spectroscopy allows the identification of the Pt active sites in the CO oxidation reaction. (a) Operando DRIFT spectra collected during the CO oxidation reaction at 50 °C on a Pt/CeO2–Al2O3 sample. The band at 2100 cm–1 is ascribed to CO adsorbed on Ptiso sites, while the bands at lower frequencies are assigned to CO interacting with WC, UC, and HUC Pt sites. (b) Consumption rate of adsorbed CO based on the numbers of different Pt sites in the same Pt/CeO2–Al2O3 catalyst, at 50 °C in the first 5 min after the introduction of O2. Adapted with permission from ref (305). Copyright 2022 Elsevier.

