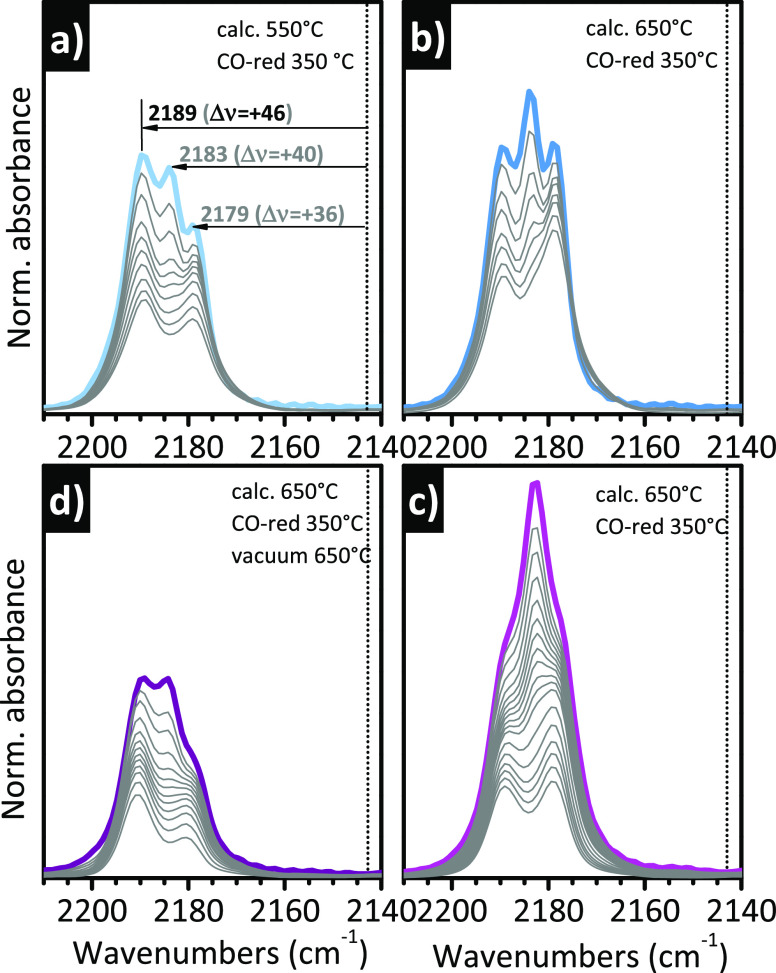
Figure 2.
IR spectroscopy allows the discrimination of Cr(II) sites as a function of their coordination environment. The figure shows the IR spectra, in the ν(CO) region, of CO adsorbed at room temperature as a function of the CO coverage on two Cr(II)/SiO2 samples subjected to a different thermal history. (a and b) Spectra of a Cr-doped glass monolith (Cr loading of 0.1 wt %) calcined either at (a) 550 or (b) 650 °C and then reduced in CO at 350 °C. Adapted with permission from ref (119). Copyright 2019 Elsevier. The two sequences of spectra have been normalized to the optical thickness of the sample, hence the absolute intensities are comparable. (c and d) Spectra of a Cr/Aerosil300 sample (Cr loading of 1.0 wt %) calcined at 650 °C and (c) reduced in CO at 350 °C or (d) successively treated under vacuum at 650 °C. Data reproduced with permission from ref (59). Copyright 2005 American Chemical Society. The two sequences of spectra have been normalized to the optical thickness of the pellet, hence the absolute intensities are comparable. In all parts, the dotted vertical line indicates ν(CO) of gaseous CO.

