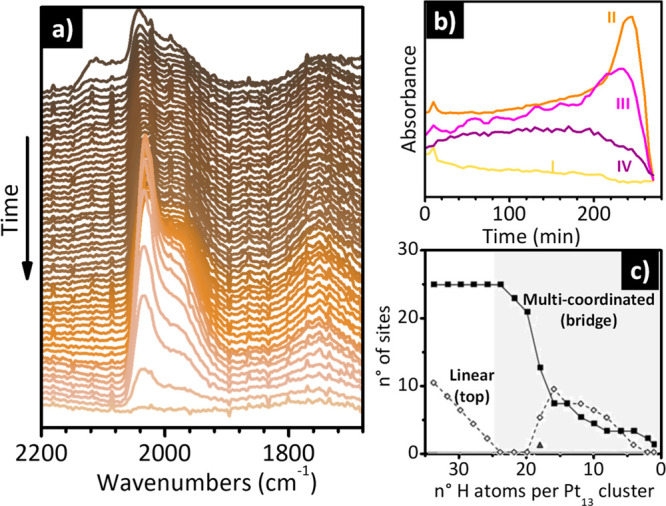
Figure 21.

Operando IR spectroscopy reveals the occurrence of H2-induced restructuring of Pt NPs on an industrial Pt/Al2O3 catalyst. (a) Evolution of the IR spectra as a function of time (from top to bottom) for a freshy reduced Pt/Al2O3 catalyst during dehydrogenation in N2 flow (20 mL/min) at 120 °C. Adapted with permission from ref (319). Copyright 2019 American Chemical Society. (b) Evolution of the intensity of the bands I–IV as a function of time for the spectra shown in part a). (c) Number of linear (top, empty circles) and multicoordinated (bridge, full squares, and hollow, triangle) occupied sites for Pt13Hn models on γ-Al2O3(100). The gray background identifies the stoichiometries accessible experimentally with the Pt/Al2O3 catalyst reported in parts (a and b). Adapted with permission from ref (280). Copyright 2011 John Wiley and Sons.
