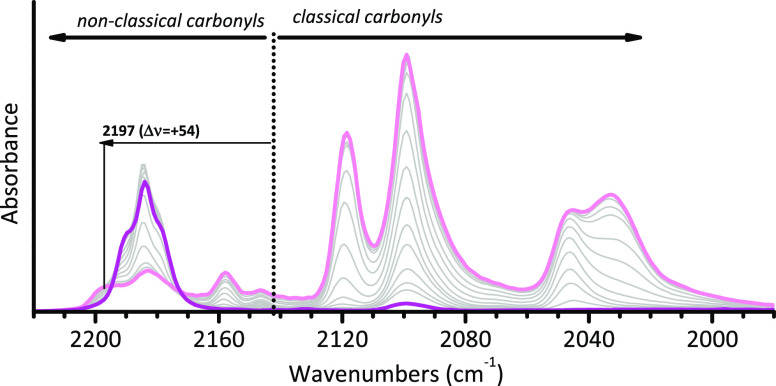
Figure 3.
IR spectroscopy reveals the CO-induced mobility of the Cr(II) sites at the silica surface, at the expense of the weaker siloxane ligands. The figure shows the IR spectra, in the ν(CO) region, of CO adsorbed at 100 K as a function of the CO coverage (light pink corresponds to maximum coverage) on a Cr(II)/SiO2 sample (Cr loading of 1.0 wt %) calcined at 650 °C and reduced in CO at 350 °C. The spectra are reported after subtraction of that collected prior to CO dosing. Data reproduced with permission from ref (59). Copyright 2005 American Chemical Society. The spectroscopic regions characteristic for classical and nonclassical carbonyls are indicated, with reference to the position of ν(CO) for gaseous CO (dotted line).

