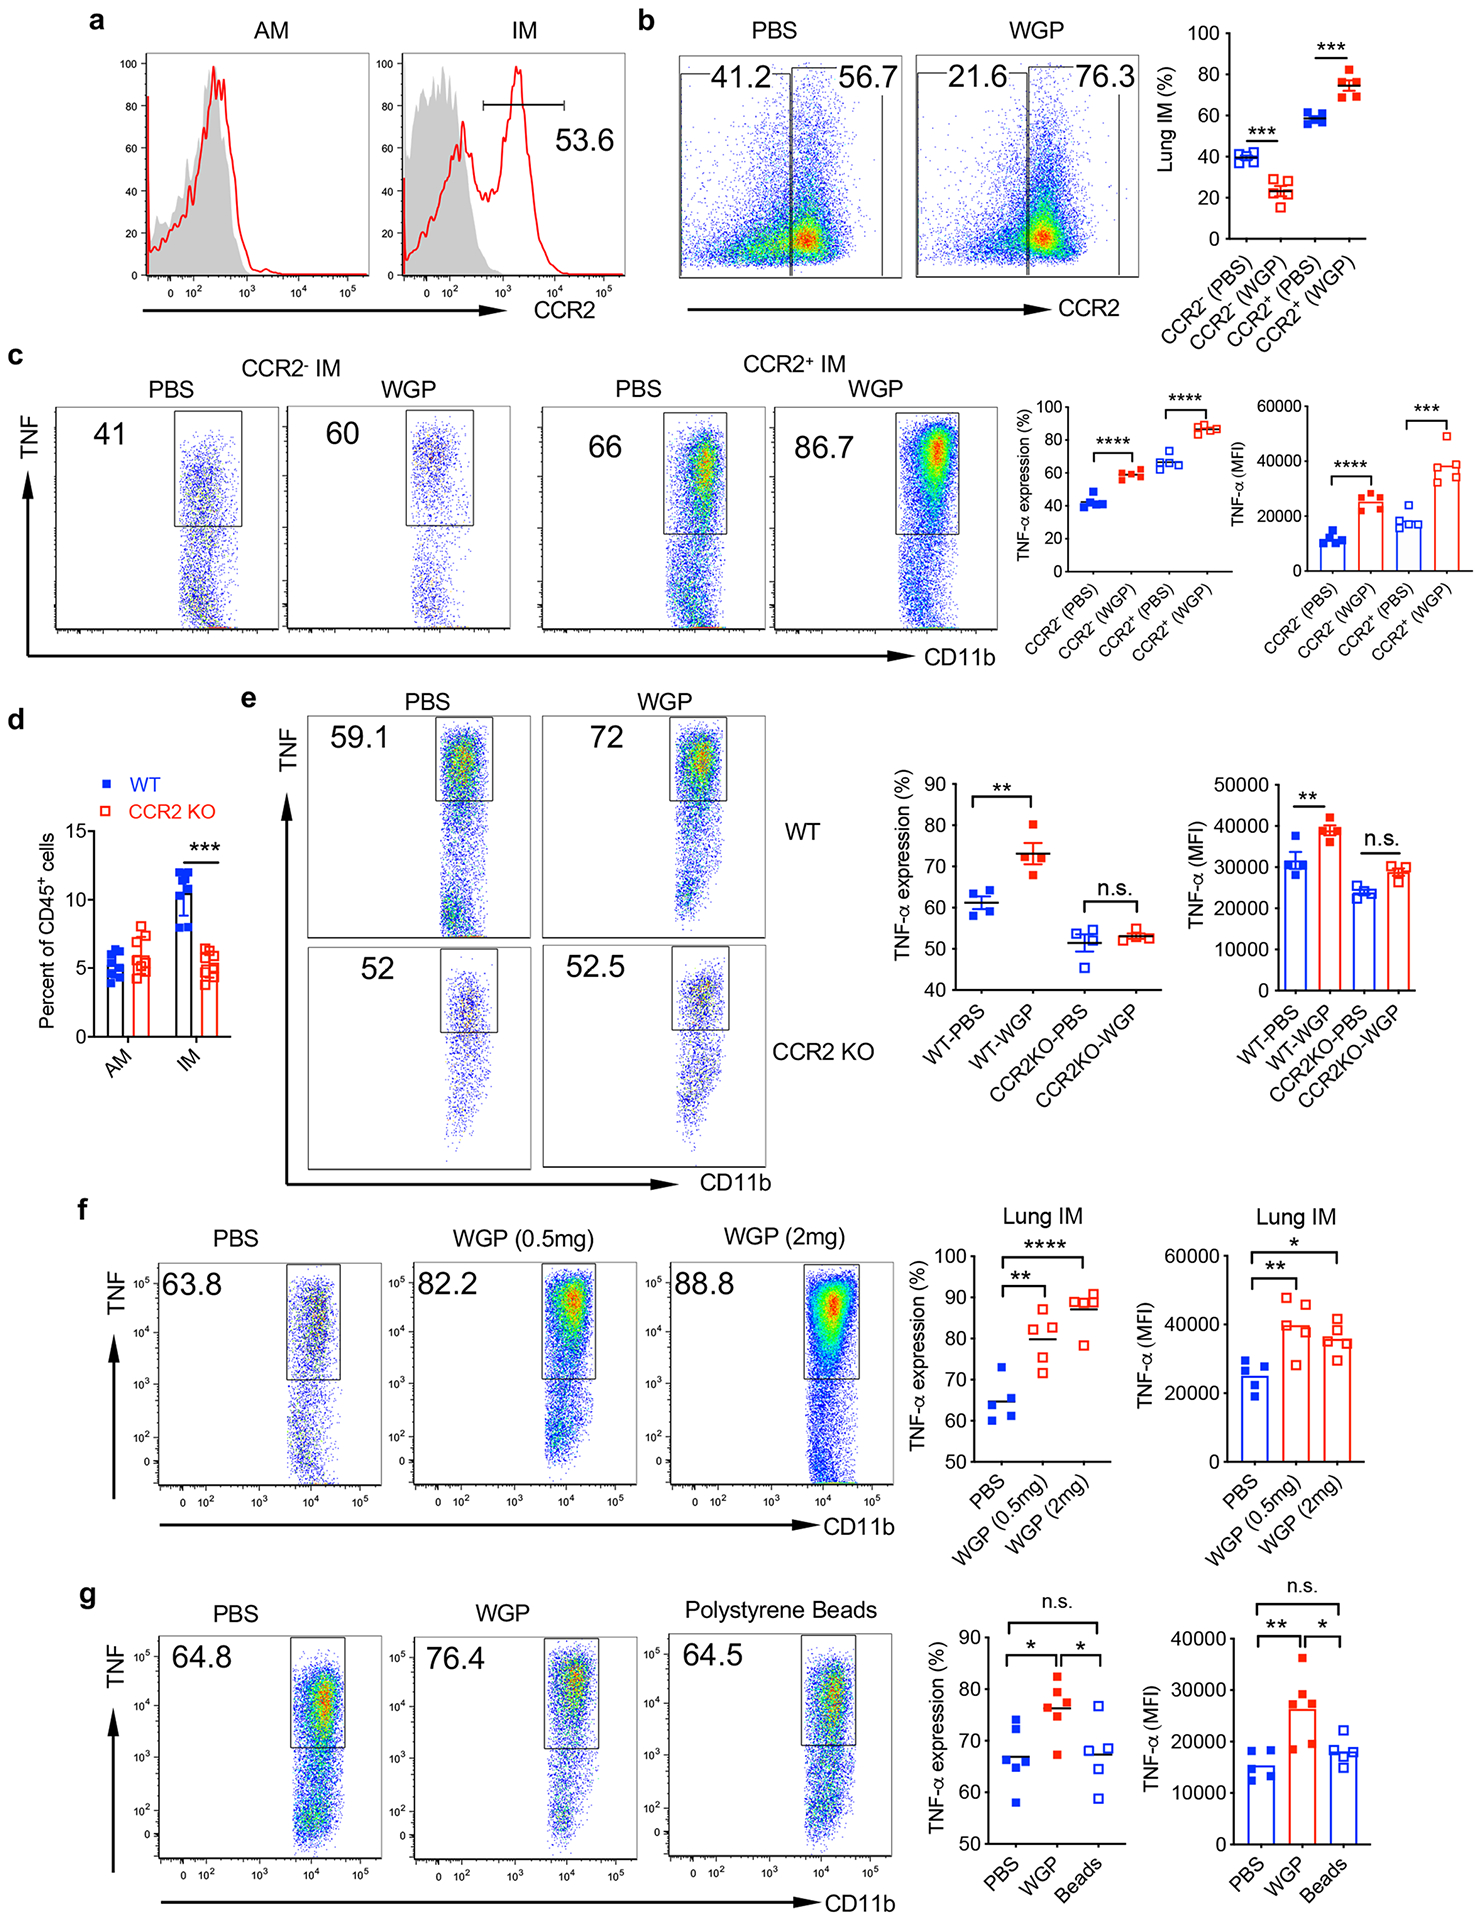
Extended Data Fig. 3 |. Lung IMs bear a trained immunity upon WGP in vivo treatment.

a, CCR2 expression on lung AMs and IMs from naïve WT C57Bl/6 mice assessed by flow cytometry. b, Mice were trained with (n = 5) or without WGP (n = 4) (1 mg IP on day 0) and euthanized at day 7. Frequency of CCR2+ and CCR2− IMs was determined by flow cytometry. Representative dot plots and summarized data are shown. c, Both CCR2+ and CCR2− IMs display a trained immunity phenotype. Lung cells from WGP-trained or control mice were restimulated with LPS and intracellular TNF production was assessed by flow cytometry. Cells were gated on CCR2+ or CCR2− IMs. d, Summarized data ofpooled two independent experiments lung AMs and IMs from WT (n = 8) and CCR2 KO (n = 8) mice. e, WT and CCR2 KO mice were trained with or without WGP (n = 4). Lung cells were restimulated with LPS. Intracellular TNF was determined by flow cytometry. Representative dot plots and summarized percent and MFI data are shown. f, Mice were IP administered with PBS or WGP (0.5 mg) or WGP (2 mg) and analyzed for the lung IM phenotype at day 7 (n = 5). Frequency and MFI for intracellular TNF expression on lung IM after ex vivo re-stimulation with LPS were determine by flow cytometry. Representative dot plots and summarized percent and MFI data are shown. g, Mice were injected IP with PBS (n = 6) or WGP (1 mg/mouse, n = 6) or polystyrene beads (1 mg, n = 5) and analyzed for the lung IM phenotype at day 7. Frequency and MFI for intracellular TNF expression on lung IM after ex vivo re-stimulation with LPS. Representative dot plots and summarized percent and MFI data are shown. Data are representative as mean ± SEM. *P < 0.05, **P < 0.01, ***P < 0.001, ****p < 0.0001. P values were derived from one-way ANOVA with Tukey’s multiple comparison test.
