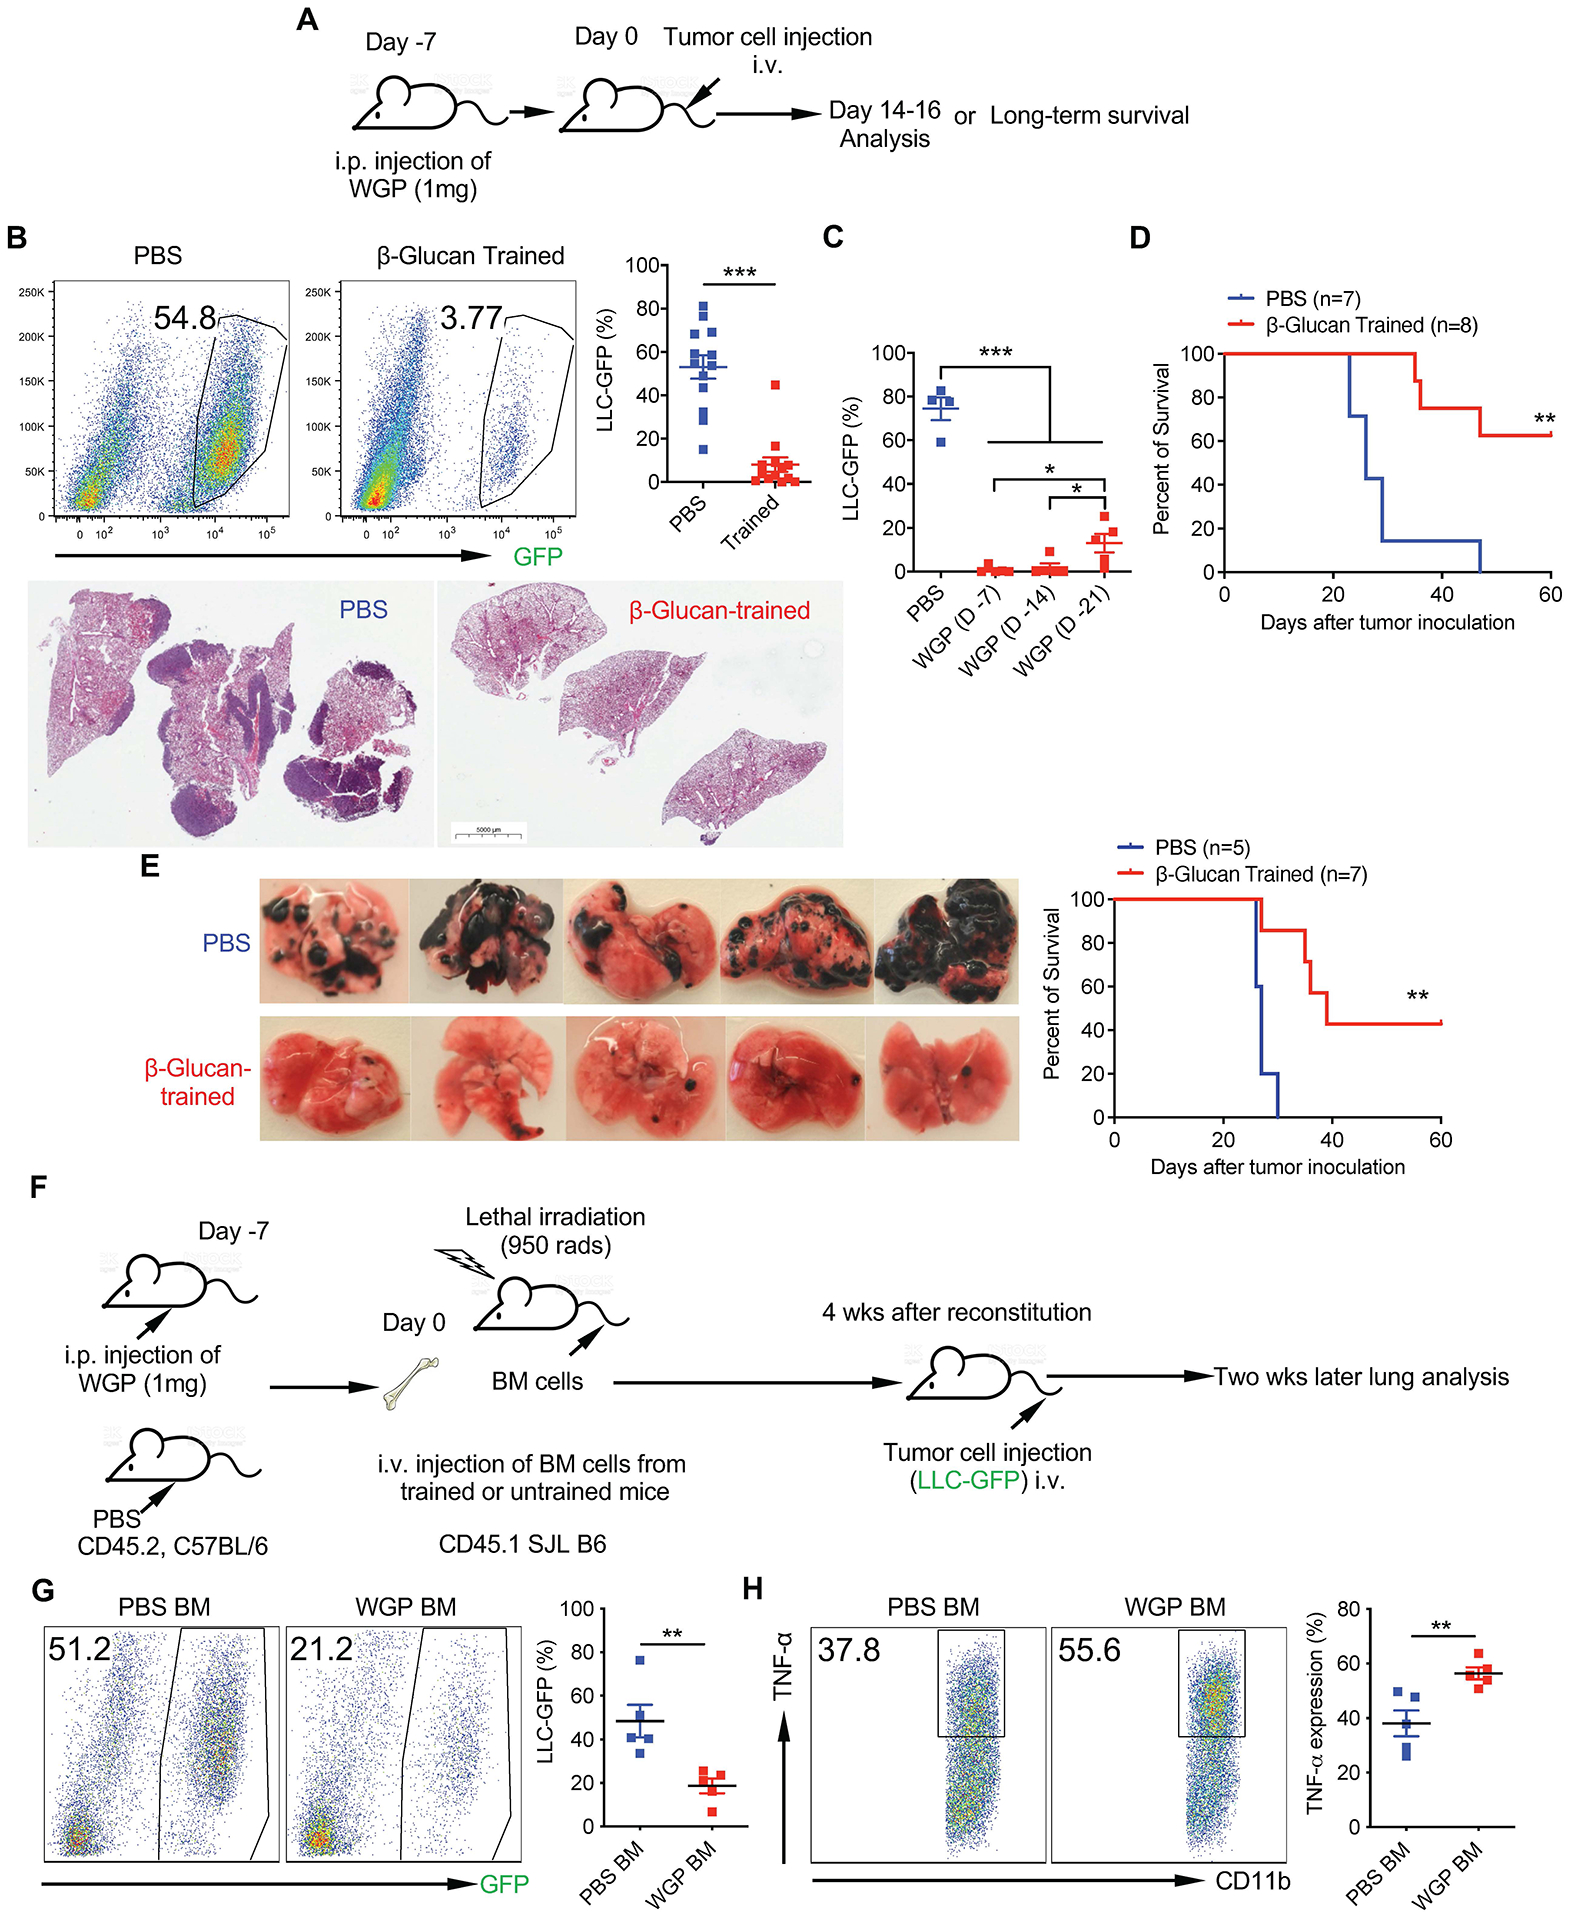
Fig. 3 |. Whole beta-glucan particle-induced trained response inhibits metastasis.

a, Schema for in vivo WGP training and tumor challenge. b, Six-week-old C57BL/6 mice trained with PBS (n = 13) and WGP (n = 13) were injected with 0.4 × 10⁶ LLC-GFP cells i.v. and tumor burden in the lungs was analyzed 14–16 d after tumor challenge by flow cytometry. Representative dot plots and summarized percentage of LLC-GFP cells in the CD45− population in the lungs are shown (up). Data are representative of two individual experiments combined. Histological analysis of the lungs from LLC-GFP tumor-bearing mice trained with PBS (n = 3) versus WGP (n = 3; down). c, Summarized frequencies of LLC-GFP cells in the lungs from tumor-bearing PBS versus WGP-trained mice. Mice were trained with PBS (n = 4) or WGP on days −7 (n = 5), −14 (n = 5) and −21 (n = 5), before tumor challenge. d, Long-term survival of mice trained with PBS (n = 7) versus WGP (n = 8) injected with 0.2 × 10⁶ LLC-GFP cells i.v. on day 0. e, Six-week-old female C57BL/6 mice were trained at day −7, challenged with i.v. injections of 0.4 × 10⁶ B16F10 tumor cells at day 0 and the lungs were collected at day 16 (left). Representative lung micrographs from PBS-trained (n = 5) versus WGP-trained (n = 5) B16F10 tumor-bearing mice. Black dots are melanoma lung metastasis nodules. Long-term survival of PBS-trained (n = 5) and WGP-trained (n = 7) mice challenged with B16F10 tumor cells (0.1 × 10⁶; right). f, Schema for BM chimeric experiment. g, Tumor burden (LLC-GFP) from recipient mice reconstituted with BM cells from WGP-trained (n = 5) or PBS control (n = 5) mice. Representative flow plots and summarized data are shown. h, Intracellular TNF production in lung IMs from mice reconstituted with BM cells from WGP-trained or PBS control mice. Data are representative of two independent experiments and presented as the mean ± s.e.m. *P < 0.05, **P < 0.01, ***P < 0.001. P values were derived from an unpaired two-tailed Student’s t-test for b, g and h, a one-way ANOVA for c and a Kaplan–Meier plot for d and e.
