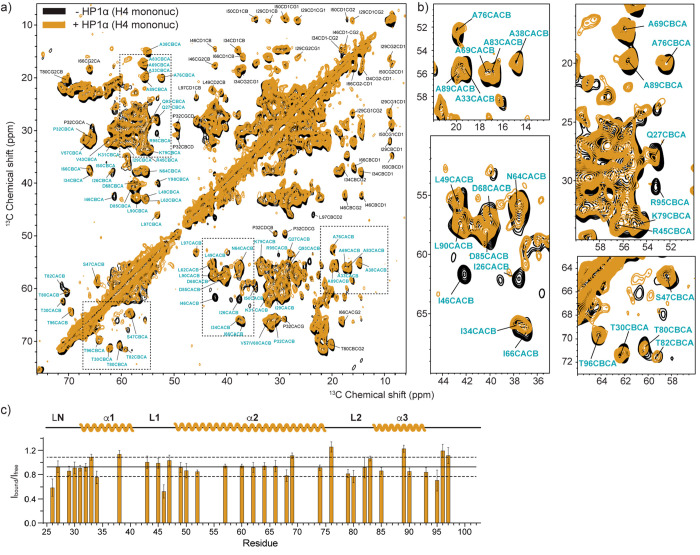
Figure 5.
MAS NMR spectroscopy of H4 in the nucleosome core. (a) 13C–13C DARR correlations of mononucleosomes containing 15N,13C-labeled H4 in the presence (gold) and absence (black) of pHP1α phase separation. (b) Zoomed in regions of the 13C–13C DARR spectrum. (c) Analysis of the peak intensity ratios of resolved Cα–Cβ correlations in the presence (Ibound) and absence (Ifree) of pHP1α. Only peaks labeled in blue were included in the analysis. Data were collected at 750 MHz 1H Larmor frequency and 11 kHz MAS spinning frequency, in the presence of 1.5 mM Mg2+. The solid line represents the average of the intensity ratios, while the dashed lines represent one standard deviation above and below. Error bars were calculated as summarized in the Experimental Section.

