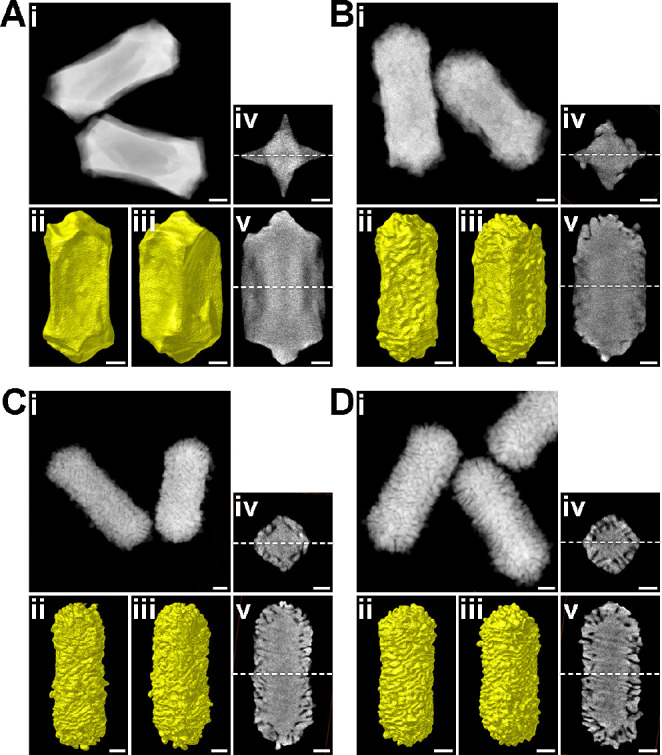
Figure 3.

Morphological characterization of Au NPs obtained by increasing the concentration of (R)-LipoCYS (A, 20 μM; B, 45 μM; C, 75 μM; D, 90 μM) during chiral overgrowth. The morphological characterization for each sample includes (i) HAADF-STEM image of several representative nanoparticles, (ii, iii) Visualizations of the 3D reconstructions, presented along different viewing angles (oriented 45° relative to each other), and (iv, v) selected orthoslices extracted from the 3D reconstructions, perpendicular to the longitudinal and transverse axes, at the center of the NRs. White dashed lines represent the relative positions of slices shown in (iv) and (v). All scale bars are 25 nm.
