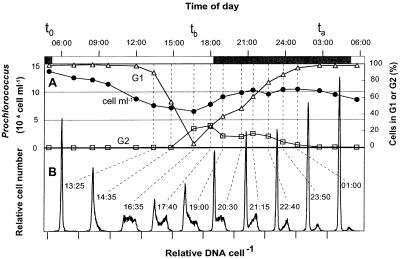
FIG. 1.
Prochlorococcus division pattern in situ (22 to 23 July 1995; 19°10′N, 67°10′E). (A) Cell concentrations and percentage of cells in G1 and G2 phases; t0, ta, and tb are the timing points used for growth rate calculations (equations 2 and 3). (B) DNA frequency distributions for selected samples (indicated by dashed lines) during the period of DNA replication and cell division. At other time points only G1 cells were present. Ticks on the x axis mark the origin for each distribution.

