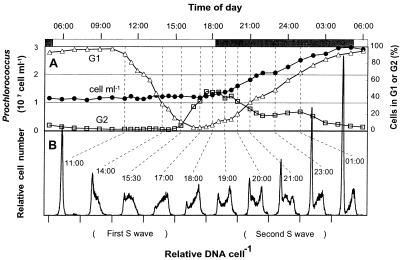
FIG. 2.
Prochlorococcus strain MIT 9302 division pattern in laboratory culture on a light-dark cycle (light intensity, 120 microeinsteins m−2 s−1). (A) Cell concentrations and percentage of cells in G1 and G2 phases. Symbols are as explained for Fig. 1. (B) DNA frequency distributions for selected samples (indicated by dashed lines).

