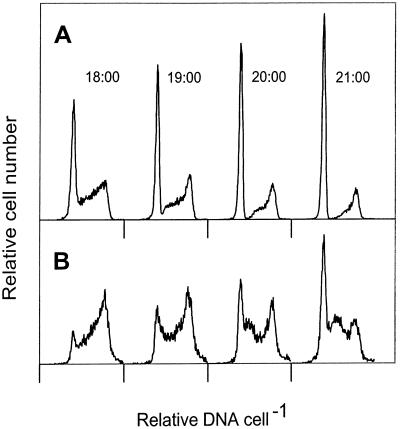
FIG. 3.
DNA frequency distributions of Prochlorococcus strain MIT 9302 at 1800 to 2100 at division rates of 0.69 div d−1 (30 microeinsteins m−2 s−1) (A) and 1.34 div d−1 (120 microeinsteins m−2 s−1) (B). Note that when the division rate is less than 1 div d−1 (panel A), there is no sign of new G1 cells entering S phase, in contrast to the clearly visible cohort of cells reentering S phase during ultradian growth (panel B).

