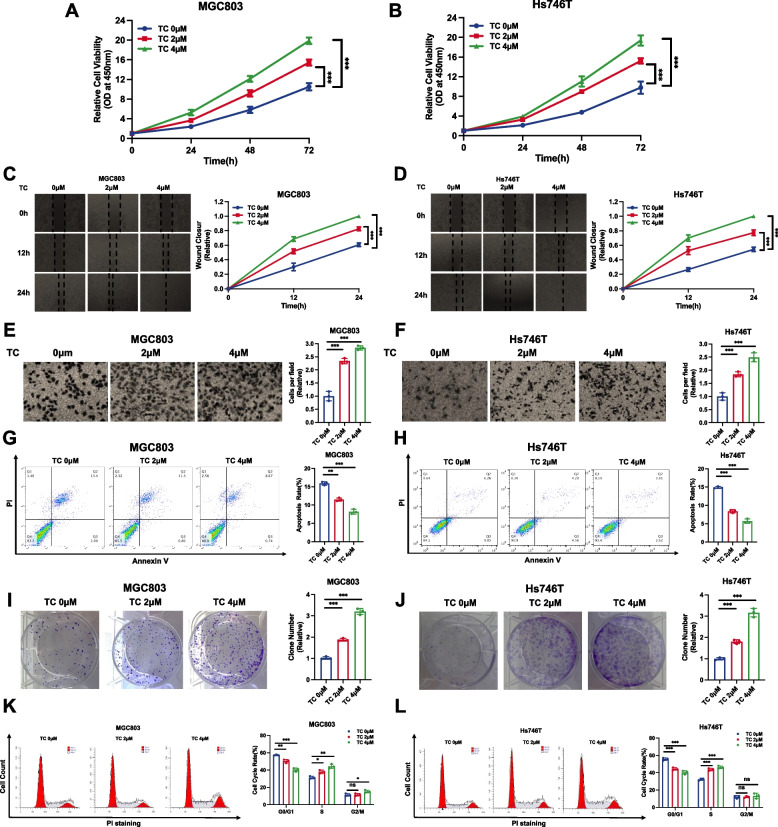
Fig. 4.
Drugs activating CXCR7 promote gastric cancer progression. A, B CXCR7 activation via TC promoted the proliferation of gastric cancer cells. MGC803 and Hs746T cells were treated with different doses of TC. After 24 h, CCK-8 assays were used to determine the metabolic activity of the cells at the indicated time points after transfection. Experiments were performed in triplicate. Comparison of cell growth, *P < 0.05, **P < 0.01, ***P < 0.001. C, D Wound healing assay of MGC803 and Hs746T cells with CXCR7 activation via TC. Wound closure was quantified for the indicated time points. Data are expressed as the mean ± SD. **P < 0.01, ***P < 0.001 (Student's t test). E, F CXCR7 activation via TC promotes the migration of MGC803 and Hs746T gastric cancer cells. MGC803 and Hs746T cells were transfected with different doses of TC. After 24 h, the migration was assessed by Transwell assays. Cell numbers were determined, and data are expressed as the mean ± SD. **P < 0.01, ***P < 0.001 (Student's t test). G, H CXCR7 activation via TC inhibited apoptosis of MGC803 and Hs746T cells. MGC803 and Hs746T cells were transfected with different doses of TC. After 24 h, the cells were stained with PI and Annexin V, and then, FACS analysis was performed on the cells to determine the proportion of apoptotic cells. Each group was analysed in triplicate. *P < 0.05; **P < 0.01; ***P < 0.001 for comparison. I, J CXCR7 activation via TC promotes the colony-forming ability of MGC803 and Hs746T gastric cancer cells. MGC803 and Hs746T cells were transfected with different doses of TC. Quantification of colony formation is shown at the indicated time points. Data are expressed as the mean ± SD. **P < 0.01, ***P < 0.001 (Student's t test). K, L Cell cycle analysis was performed to assess the effect of CXCR7 activation via TC on MGC803 cells and Hs746T cells. MGC803 and Hs746T cells were transfected with different doses of TC. After 24 h, the cells were harvested, fixed in 70% ethanol and stained with propidium iodide. Cells were subjected to FACS analysis. Experiments were performed in triplicate. Comparison of cell proportions, *P < 0.05, **P < 0.01, ***P < 0.001. Representative histograms and cell cycle phase distribution plots are shown in Fig. 4 K and L, respectively

