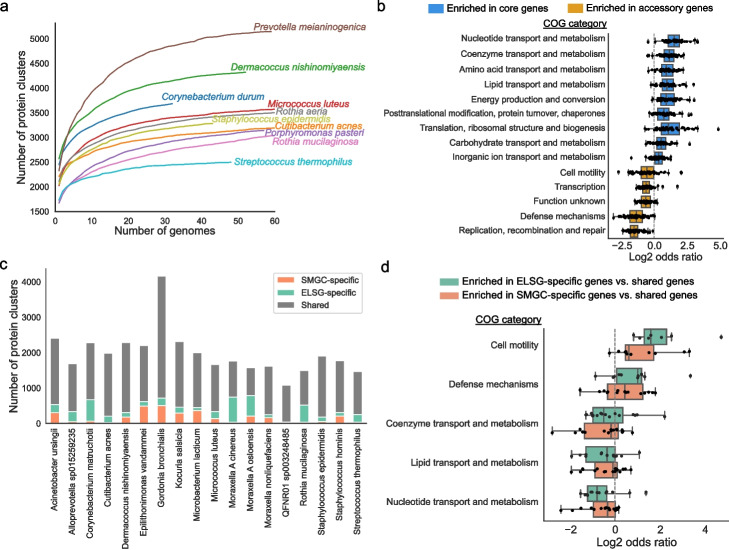
Fig. 4.
Proteins and functions of early-life skin microbiome. a Rarefaction curves of the number of protein clusters obtained as a function of the number of species-level genomes. Each curve represents one species. The curves for species with more than 60 genomes are truncated for visualization purpose. b Comparison of the functional categories assigned to the core and accessory genes for species with at least 10 near-complete or high-quality genomes (> 90% completeness, < 5% contamination). Each dot represents one species. Odds ratio was calculated from the contingency table with core and accessory genes on one axis and the tested and the other functional categories on the other axis. Only significantly enriched functional categories are shown. Significance was calculated with a two-tailed t-test on log-transformed odds ratios and further adjusted for multiple comparisons using the Bonferroni correction. c Comparison of the protein clusters between the ELSG and the SMGC for species with at least five near-complete or high-quality genomes in each catalog. d Functional categories enriched in ELSG-specific and SMGC-specific genes compared to shared genes. Each dot represents a species. Only statistically significant categories are shown

