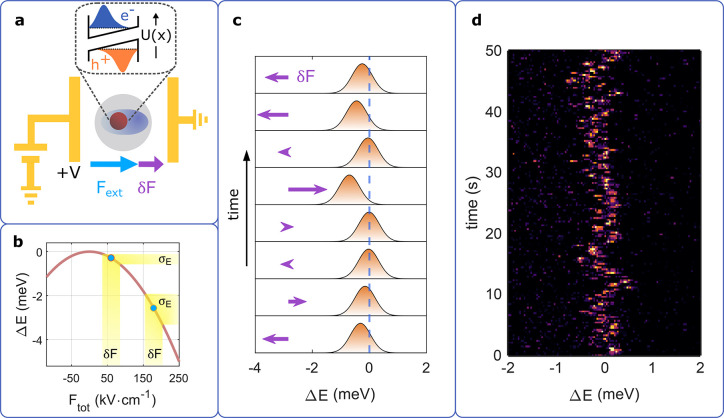
Figure 1.
Relation between QCSE and SD. (a) Schematic illustration of the sample: single nanorod placed between two electrodes so that an external field Fext can be applied in addition to an intrinsic microscopic field δF. The electric bias causes a distortion of the carrier confinement potential and thereby a reduced transition energy (inset). (b) Qualitative example of the red-shift due to QCSE. The energy shift depends quadratically on the electric field. For a larger red-shift, the same δF amplitude induces stronger fluctuations in energy σE (yellow highlight). (c) Schematic illustration of SD caused by QCSE. Random microscopic field fluctuations (purple arrows) cause an energy redshift that depends quadratically on the field strength. (d) Example data set showing SD. The photoluminescence spectra (each 0.3 s integration time) of a single CdSe/CdS core/shell nanorod at T = 6 K exhibit sub-meV irregular fluctuations in energy.

