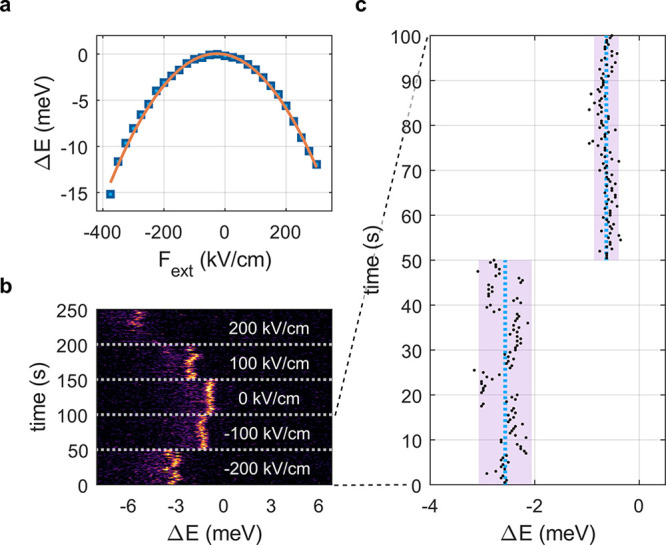
Figure 3.

Joint measurement scheme for the QCSE and SD. (a) The energy shift of the brightest spectral peak vs nominal field amplitude for a single nanoparticle (blue squares). A parabolic fit is overlaid in orange. (b) Consecutive PL spectra (0.5 s acquisition time) taken for the same QD. The applied external field is changed every 50 s (white dashed lines; field value given alongside). (c) Momentary energy shift analyzed for the first 100 s of the measurement in (b). Light blue dashed lines indicate the mean energy shift, and violet rectangles display the region of two standard deviations to each side of the mean.
