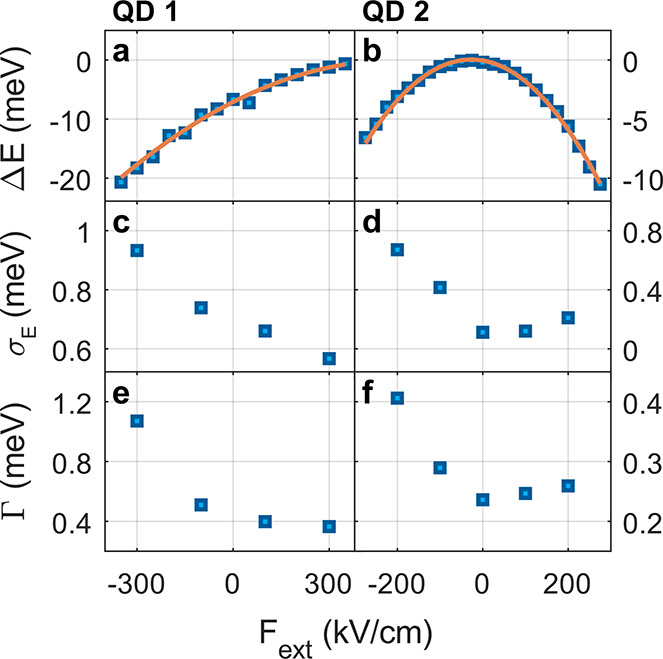
Figure 4.

SD measurements for two individual nanoparticles. The energy shift of the PL emission versus the applied electric field for (a) QD1 and (b) QD2 was analyzed from an electric-field-scan measurement. Orange lines are a parabolic fit for the QCSE following eq 1. The standard deviation of PL emission peak energy was analyzed from a time series of spectra, as shown in Figure 3b, for (c) QD1 and (d) QD2. Dependence of the spectral width of the emission line, after correction for slow SD, is dependent on the external electric field for (e) QD1 and (f) QD2.
