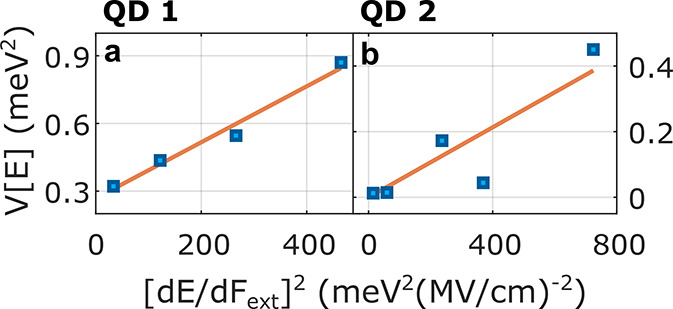
Figure 5.

A quantitative analysis of the relation
between SD and QCSE. The
dependence of slow fluctuations variance (σE2) on the square
of the derivative of the energy with respect to the electric field
for (a) QD1 and (b) QD2. Linear fits (orange lines) indicate that
the model presented in eq 5 is in good agreement with our results for parameter values.  (QD1) and
  (QD2).
