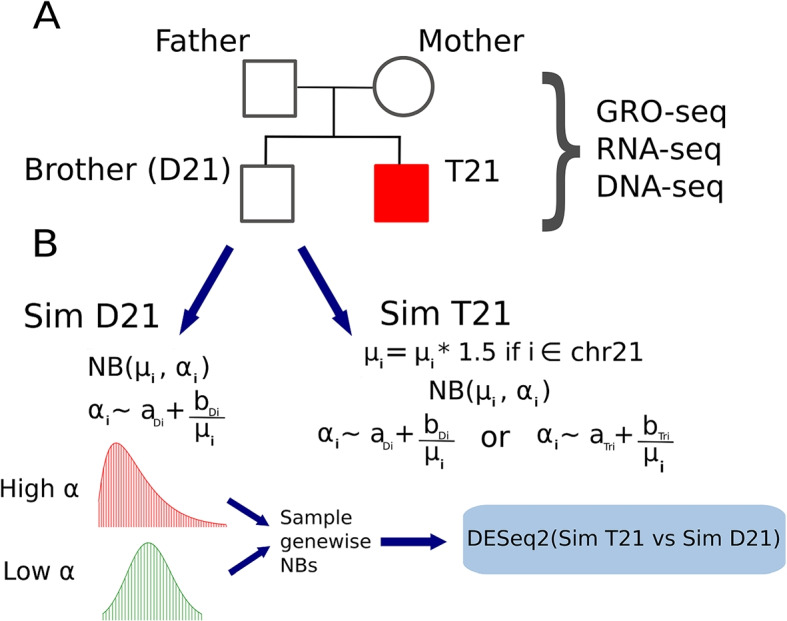
Fig. 1.

Summary of cell line generation and dataset simulation. A Pedigree depicting the relationship of our samples. Lymphoblastoid cell lines (LCLs) were derived from each of the individuals. Libraries for GRO-seq, RNA-seq, and DNA-seq were generated from these cell lines for downstream analysis. B Simulations generated from the D21 child. The RNA-seq datasets from this individual were averaged together to inform the mean counts (mu) for each gene i. The hyperparameters a (termed asymptotic dispersion) and b (termed extra-Poisson noise) are used to inform the gene-wise dispersion of each negative binomial (NB) distribution. New read datasets for each gene were then generated by random variate sampling from these distributions. For trisomic genes, the mean of the negative binomial distribution (represented as mu) is first multiplied by 1.5, ensuring that calculated fold change estimates between trisomic and disomic genes should yield an expected distribution around 1.5, modulated by dispersion. Varying hyperparameters were used to generate multiple simulated datasets
