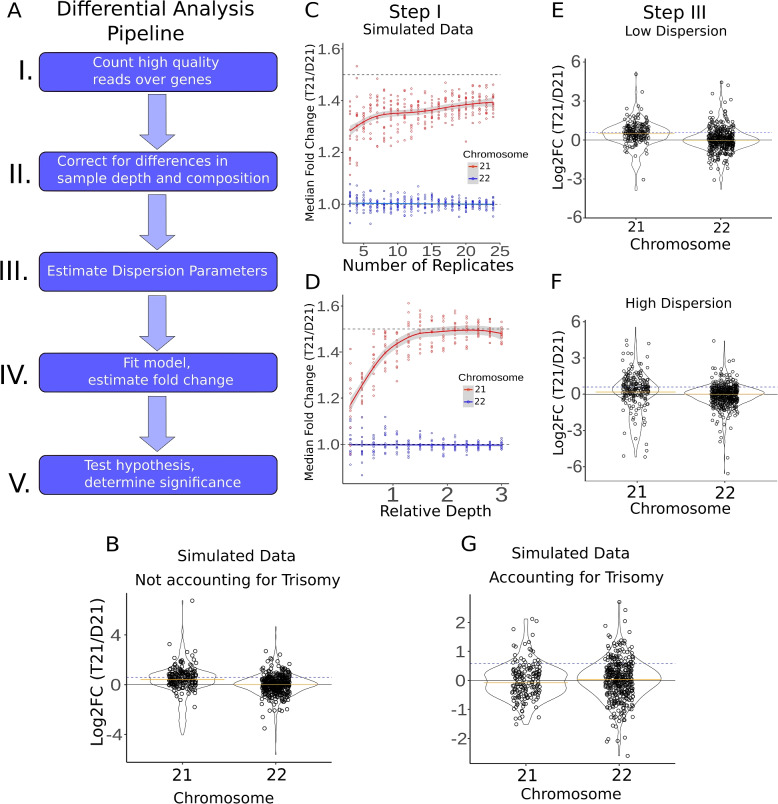
Fig. 2.
Fold change distributions of RNA-seq and GRO-seq datasets. A Pipeline of differential analysis. Variations at any step have the potential to increase or decrease fold change calculations for chromosome 21 genes (see also Additional File 1: Figs. S11, S15, S16). B Naive differential analysis of simulated T21 and D21 datasets using the similar dispersion parameters found in real data (asymptotic dispersion = 0.03, extra-Poisson noise = 3.5, see Additional File 1: Fig. S11). For chromosome 21 genes (which were simulated at 1.5×), the median fold change is 1.40. C Effects of shifting parameters of simulated datasets. Simulated datasets with varying numbers of replicates (asymptotic dispersion = .01, extra-Poisson noise = 1). D Simulated datasets with varying levels of depth (asymptotic dispersion = .01, extra-Poisson noise = 1). E Violin plots showing fold changes of simulated datasets when dispersion parameters are low (asymptotic dispersion = .01, extra-Poisson noise = 1). The orange line is the Median Fold Change (MFC). F Violin plots showing fold changes of simulated datasets when dispersion parameters are high (asymptotic dispersion = .05, extra-Poisson noise = 30). The orange line is the Mean Fold Change (MFC). G Simulated data violin plots showing fold changes after applying adjustments for each step in the pipeline. Results are consistent with no dosage compensation in T21 datasets in the simulated data

