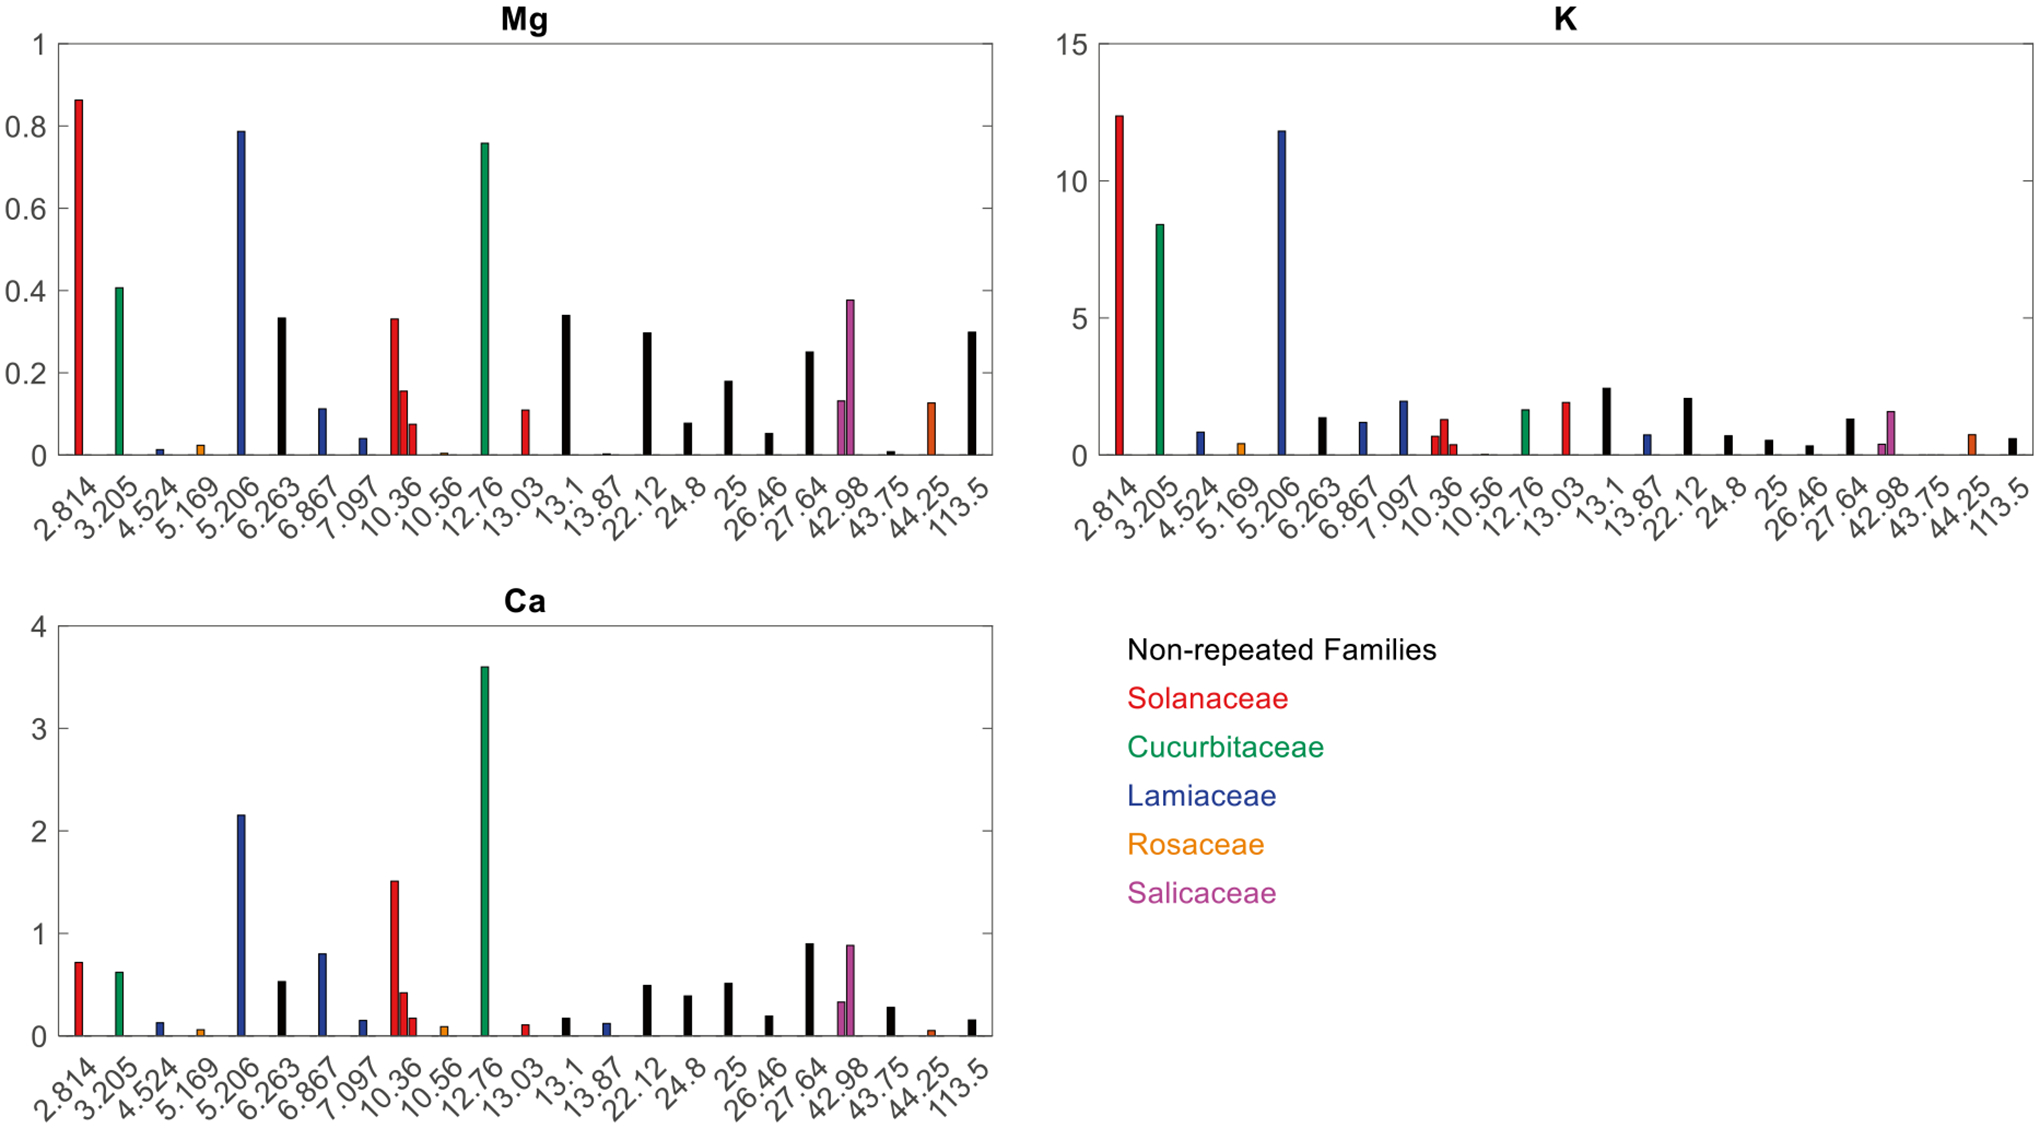
Fig. 2.

Concentration (y-axis; μg cm−2) versus surface area (x-axis; cm−2) of selected plant macronutrients. The colors represent different family types repeated (i.e., more than one representative sample) in the dataset (see legend). The black bars signify different, non-repeating families. Refer to Table S1 for numerical concentration results
